
 +86 18574103366
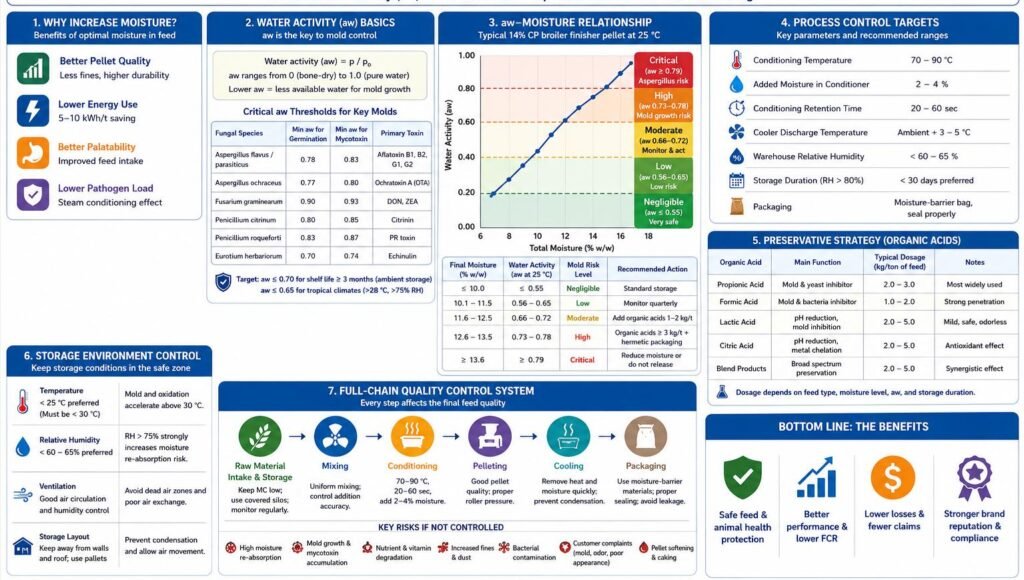
Moisture content (MC) and water activity (aw) are the two central determinants of feed shelf life, yet they measure fundamentally different things and must be managed as distinct parameters. Moisture content measures total water in a feed sample—both bound and free—while water activity measures only the thermodynamic energy of free water available to drive microbial growth, chemical reactions, and physical deterioration. Two feeds with identical MC can have dramatically different shelf lives depending on how water is distributed and bound within the feed matrix.
This report analyses the scientific basis of the relationship between MC, aw, and shelf life in animal feed production. It covers the mechanisms by which free water drives microbial spoilage (bacteria, mould, mycotoxin production), chemical degradation (lipid oxidation, Maillard browning, vitamin breakdown), and physical changes (caking, texture loss). Quantitative data are presented on the aw thresholds for different spoilage organisms, the non-linear MC–aw relationship expressed through moisture sorption isotherms, and the role of temperature, packaging permeability, and storage conditions in governing the rate of shelf-life deterioration. The report concludes with control strategies spanning process design, additive technology, packaging selection, and storage management.
1. Introduction: Why Shelf Life Is a Moisture Problem
Shelf life is one of the most commercially critical quality parameters in animal feed. Feed manufacturers must guarantee that product remains safe, nutritionally adequate, and palatable for a defined period from manufacture—typically 3 to 18 months depending on feed type and formulation. Shelf life failure imposes direct costs through product recalls, animal performance losses, mycotoxin-related veterinary incidents, and brand damage.
At its core, virtually every mode of feed shelf-life failure is driven by water. Microbial spoilage—the most dangerous failure mode—requires free water. Chemical degradation reactions (lipid oxidation, Maillard browning) are strongly influenced by water availability. Physical deterioration (caking, hardening, textural change) depends on moisture exchange between the feed and its environment.
Yet moisture is also commercially valuable: moisture retained in finished feed is saleable weight, and an excessively dry feed sacrifices yield and can actually accelerate some chemical degradation reactions (lipid oxidation increases at very low aw). The challenge of feed shelf-life management is therefore to find and hold the optimal moisture state—maximising retained weight while maintaining aw below the thresholds that drive spoilage.
Global compound feed production reached 1.396 billion metric tonnes in 2024 (Alltech Agri-Food Outlook, 2025). At this scale, even small improvements in shelf-life management—through better aw control—represent enormous commercial value in terms of reduced waste, lower antifungal additive cost, and improved product quality at the point of use.
2. Fundamental Concepts: MC, aw, and Their Relationship
2.1 Moisture Content (MC)
Moisture content is expressed as a percentage of total product mass (wet-weight basis) and quantifies the total water present in a feed sample—both water tightly bound to macromolecules (bound water) and water freely available in the intergranular space (free water). It is the standard reporting metric in feed quality specifications and regulatory frameworks.
MC alone is an incomplete predictor of shelf life because it does not distinguish between bound and free water. Bound water is held by hydrogen bonds to feed matrix components (proteins, starch, fibre) and is largely unavailable for microbial metabolism. Free water is mobile, easily exchangeable with the environment, and directly supports microbial growth and chemical reactions.
2.2 Water Activity (aw)
Water activity (aw) is a thermodynamic property defined as the ratio of the water vapour pressure in a feed sample (p) to the vapour pressure of pure water at the same temperature (p₀): aw = p/p₀. It is dimensionless, ranging from 0 (completely anhydrous) to 1.0 (pure water). At equilibrium, aw equals the fractional equilibrium relative humidity (ERH) of the surrounding air: aw = ERH/100.
aw measures only the energy status of free water—precisely the fraction that is available for microbial growth, enzymatic activity, and chemical reactions. It is therefore a fundamentally better predictor of shelf life than MC. Two feeds may have the same MC but different aw values depending on ingredient composition, particle structure, and processing history; conversely, two feeds with the same aw may have very different MC values.
Key regulatory reference point: the US FDA has codified aw ≤ 0.85 as the boundary for potentially hazardous food determinations (21 CFR Parts 108, 113, 114). For compound animal feed, industry targets a more conservative aw ≤ 0.70 for finished product, with ≤ 0.65 as the preferred target for mould inhibition.
2.3 The Moisture Sorption Isotherm: Mapping the MC–aw Relationship
The relationship between MC and aw is not linear—it is product-specific, temperature-dependent, and directionally asymmetric (showing hysteresis). A moisture sorption isotherm is a curve that graphically maps this relationship for a specific feed at a constant temperature.
Key features of moisture sorption isotherms relevant to feed shelf life:
- Non-linearity: a small increase in aw at the high end of the scale (e.g., from 0.65 to 0.75) may correspond to a large increase in MC, and vice versa at the low end. This means that small changes in ambient humidity can cause disproportionate changes in feed aw and spoilage risk
- Product specificity: each feed formulation has a unique isotherm, reflecting its macronutrient composition, particle size distribution, and processing history. A high-starch poultry feed will have a different MC–aw curve than a high-fat aqua-feed
- Temperature dependence: at constant relative humidity (RH), most feeds show decreased MC as temperature rises. Higher temperatures reduce the capacity of the feed matrix to hold bound water, increasing the proportion of free water and raising aw at the same MC level
- Hysteresis: the adsorption isotherm (MC as the feed absorbs moisture from a dry state) and the desorption isotherm (MC as the feed releases moisture from a wet state) are not identical. At the same aw, a feed that has been previously wet and is now drying will retain more moisture than one that has been dry and is absorbing. This means recently dried feed may be at higher microbial risk than its aw reading suggests
Isotherms are practical tools for feed mill engineers: they can be used to determine (a) the minimum MC at which a formulation becomes microbiologically safe for storage, (b) the maximum MC achievable without exceeding the aw safety threshold, and (c) how packaging permeability will affect aw during storage across different climate conditions.
| Feed Type | Typical MC Range (%) | Typical aw Range | Key Shelf-Life Risk |
| Dry compound feed (poultry/livestock) | 11–13% | 0.55–0.70 | Mould above aw 0.65; Maillard browning |
| Dry pet food (kibble) | 8–10% | 0.50–0.65 | Lipid oxidation; mould if moisture ingress |
| Semi-moist feed / treats | 15–30% | 0.60–0.85 | Mould; yeast; osmophilic organisms |
| Wet / canned feed | > 60% | 0.90–0.99 | Requires hermetic seal + heat treatment |
| Aqua-feed (floating pellet) | 8–11% | 0.50–0.65 | Lipid oxidation; moisture ingress in humid climates |
| Raw material (cereals at intake) | 12–16% | 0.65–0.80 | Mould in storage silos; mycotoxin risk if > 0.70 |
Table 1. Typical MC and aw ranges by feed type and primary shelf-life risk. Sources: IRIS-Eng; BSM Partners; industry data.
3. Microbial Spoilage: The Dominant Shelf-Life Failure Mode
Microbial spoilage—growth of bacteria, moulds, and yeasts—is the most serious feed shelf-life failure mode because it directly compromises animal health through pathogen exposure, mycotoxin production, and nutritional degradation. All microbial growth requires free water; aw is therefore the primary determinant of microbial shelf-life risk.
3.1 aw Thresholds by Organism Class
Different classes of microorganism have different minimum aw requirements for growth. These thresholds are well established in the scientific literature and form the scientific basis for feed safety limits:
- Most pathogenic bacteria (Salmonella spp., Escherichia coli, Listeria monocytogenes): minimum aw for growth ≈ 0.91. Below this threshold, vegetative bacterial cells cannot reproduce, though they may survive in a dormant state
- Most spoilage bacteria: minimum aw for growth ≈ 0.90. The FDA Food Code designates aw > 0.85 as the threshold for ‘potentially hazardous’ foods requiring temperature control
- Most common feed moulds (hydrophilic fungi, including Fusarium spp.): minimum aw ≈ 0.90. Fusarium species show strong positive associations with high-moisture matrices (aw > 0.90)
- Mesoxerophilic moulds (Aspergillus spp.): can grow at aw 0.80–0.90. Aspergillus flavus—the primary aflatoxin producer—dominates dry substrates at aw < 0.75
- Xerotolerant moulds (Penicillium spp.): can grow at aw as low as 0.78–0.80
- Xerophilic moulds and osmophilic yeasts: some species can grow at aw 0.60–0.70. All microbial growth ceases below aw 0.60
- Minimum aw for mycotoxin production: aw 0.80; the majority of mycotoxigenic moulds do not produce mycotoxins below aw 0.85 (ScienceDirect review, 2013)
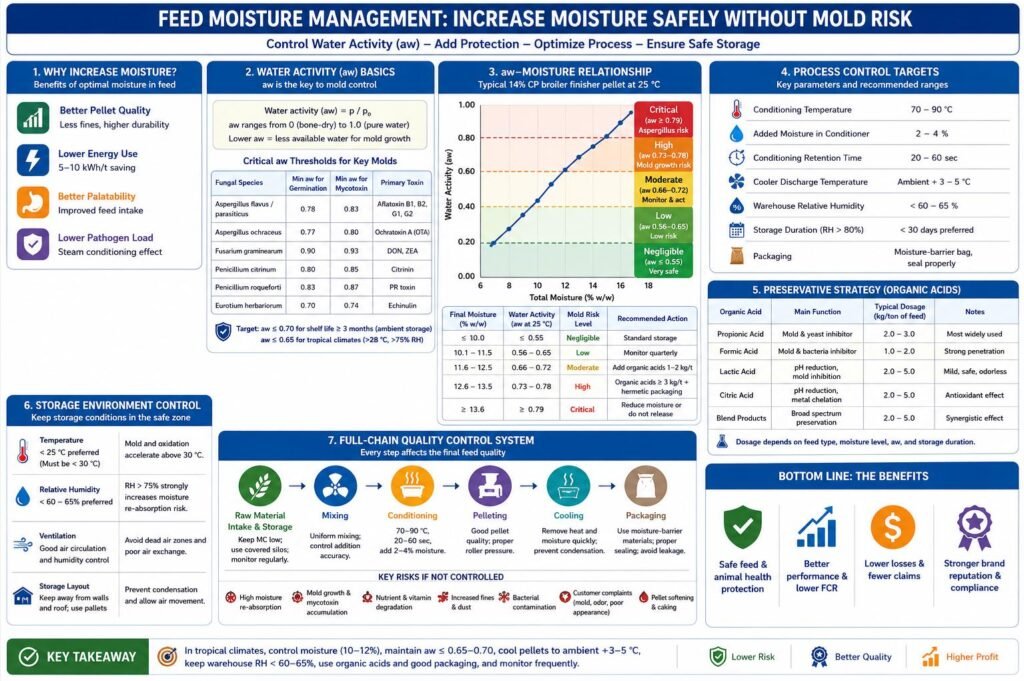
The practical implication for feed shelf life: maintaining finished feed aw ≤ 0.70 inhibits most moulds and all common bacterial pathogens. Maintaining aw ≤ 0.65 provides an additional safety margin against xerotolerant species and is the preferred target for tropical or long-storage applications.
3.2 Mycotoxin Production: A Special Case
Mycotoxins (aflatoxins, fumonisins, deoxynivalenol [DON], zearalenone, ochratoxin A [OTA]) present a particularly serious shelf-life risk because they are thermostable—surviving feed manufacturing processes—and highly toxic at very low concentrations. Key data:
- Optimal conditions for Aspergillus flavus growth: 28–40°C and aw 0.94–0.99; optimal aflatoxin production: 25–33°C and aw 0.92–0.96 (PMC/NCBI review)
- Ochratoxin A (OTA) in corn silage: concentrations increased from approximately 12 μg/kg at onset of ensiling to > 240 μg/kg at silo opening, indicating continued accumulation under sub-optimal storage conditions (NCBI/PMC, 2025 dairy cattle study)
- Zearalenone (ZEA) concentrations oscillated from 40 to 170 μg/kg during storage periods in the same study, demonstrating non-linear mycotoxin dynamics that are difficult to predict from aw alone
- Prevention principle: the Canadian Food Inspection Agency (CFIA) recommends reducing moisture to below the equivalent of aw 0.70 (< 14.5% MC by weight) as the primary prevention strategy for mould growth and mycotoxin production
- Stability of mycotoxins once formed: mycotoxins resist high temperatures (zearalenone stable during storage, milling, and cooking); therefore, prevention through aw control is critical—remediation after contamination is often impractical
Because mycotoxin production is not initiated until aw exceeds 0.80 even by xerophilic producers, maintaining finished feed aw ≤ 0.70 provides an absolute barrier against de novo mycotoxin synthesis during storage—even if mould spores are present on the feed.
3.3 Temperature × aw Interaction
Temperature and aw interact multiplicatively to determine microbial growth rate and mycotoxin production. At a given aw, higher storage temperatures accelerate mould growth and mycotoxin synthesis up to the organism’s temperature optimum, then inhibit it above the maximum growth temperature. This interaction is critical for shelf life in tropical or seasonally hot climates:
- A. flavus grows optimally at 30–35°C and aw 0.99; aflatoxin production optimal at 25–30°C and aw 0.99 / at 30–35°C and aw 0.95 (PMC study)
- Aflatoxin production is suppressed above 32–35°C despite continued fungal growth—this provides a partial temperature-based safety margin at very high temperatures
- At 42°C, different aw values caused inhibited fungal growth, indicating high-temperature extremes can partially compensate for elevated aw—but this cannot be relied upon under commercial storage conditions
- Practical consequence: feed produced at aw 0.68 in a temperate climate (safe margin) may become unsafe if stored in a tropical warehouse at 35°C where the effective EMC of the storage environment drives aw upward through moisture adsorption
| Organism/Toxin | Minimum aw for Growth | Optimal aw Range | Minimum aw for Toxin | Feed Safety Implication |
| Most pathogenic bacteria (Salmonella, E. coli) | 0.91 | 0.97–0.99 | N/A | Dry feed (aw ≤ 0.85) inhibits growth |
| Fusarium spp. (DON, ZEA, fumonisins) | 0.90 | 0.95–0.99 | ~0.90 | High-moisture feed at risk; silage management critical |
| Aspergillus flavus (aflatoxins) | ~0.78 | 0.94–0.99 | 0.80–0.83 | Dry grain storage at aw < 0.70 provides safety margin |
| Aspergillus parasiticus (AFB1) | ~0.78 | 0.95–0.98 | 0.80 | Requires tight aw control in hot, dry climates |
| Penicillium spp. (OTA) | 0.78–0.80 | 0.85–0.95 | ~0.80 | Intermediate moisture feeds at risk |
| Xerophilic/osmophilic moulds and yeasts | 0.60–0.70 | 0.75–0.85 | > 0.80 | Semi-moist feeds require additional preservatives below aw 0.80 |
| All microbial growth (absolute minimum) | < 0.60 | — | — | aw ≤ 0.60 is universally safe but too dry for yield targets |
Table 2. aw thresholds for growth and mycotoxin production by major feed spoilage organisms. Sources: SpringerLink; ScienceDirect; PMC; Manitoba Agriculture.
4. Chemical Degradation: Shelf-Life Failure Below the Microbial Threshold
Even when aw is maintained below 0.70—well within the mould-inhibition zone—chemical degradation reactions continue to reduce feed nutritional value and palatability over time. These reactions are aw-dependent but not aw-limited in the same way as microbial growth: they can occur across a wide aw range and sometimes accelerate at very low aw values.
4.1 Lipid Oxidation (Rancidity)
Lipid oxidation is the primary chemical shelf-life failure mode for high-fat feeds (aqua-feeds, pet food, poultry starter crumbles, and feeds with post-pellet fat coating). Oxidation of unsaturated fatty acids produces volatile aldehydes, ketones, and peroxides that reduce feed palatability and destroy fat-soluble vitamins (A, D, E, K).
The aw–lipid oxidation relationship is non-linear and counterintuitive:
- At very low aw (0.0–0.33): lipid oxidation rate is high. The absence of water removes antioxidant-protective hydration of metal catalysts and reduces the quenching capacity of water for free radicals. Freeze-dried beef patties showed maximum lipid oxidation at aw 0.0–0.33 in storage trials at 49°C (Sun et al.)
- At monolayer aw (0.20–0.40): lipid oxidation rate is minimised. The monolayer water content represents the moisture level at which all primary sorption sites are saturated; this layer provides maximum protection against oxidative catalysts
- At aw 0.40–0.70: oxidation rate increases with aw as water mobilises metal catalysts and increases contact between oxygen and unsaturated fat
- At aw > 0.70: oxidation continues to increase, but microbial growth now becomes the dominant concern
The practical implication: extreme drying of high-fat feeds (below monolayer aw ≈ 0.20–0.25) actually increases rancidity risk. Antioxidant addition (BHA, BHT, mixed tocopherols, rosemary extract) and oxygen-barrier packaging are the primary mitigations for lipid oxidation in low-aw feeds.
4.2 Maillard Browning (Non-Enzymatic Browning)
The Maillard reaction between reducing sugars and free amino acids reduces available lysine content, darkens feed colour, generates off-flavours, and can reduce feed palatability. It is particularly relevant in feeds with high cereal and protein co-product inclusion:
- Maillard reaction rate is maximal in the intermediate aw range of 0.40–0.80—precisely the range of most compound feeds
- At aw 0.30, products are considered stable with respect to non-enzymatic browning (PMC/NCBI citation)
- Higher storage temperatures dramatically accelerate Maillard browning: storage at 35°C vs. 25°C can accelerate shelf-life reduction by 65% for moisture-sensitive packaged formulations (amaranth-sorghum complementary food shelf-life model, PMC 2020)
- Heat-damaged protein (measured as acid-detergent insoluble nitrogen, ADIN) from in-bag Maillard reactions is a marker of nutritional quality loss during storage; it increases with both temperature and aw
4.3 Vitamin Degradation
Fat-soluble vitamins (A, D, E) and water-soluble vitamins (B-complex, ascorbic acid) degrade during feed storage through oxidation, hydrolysis, and photolysis:
- Vitamin A (retinol): highly susceptible to oxidative degradation, particularly at aw > 0.40 or in the presence of residual oxygen in packaging
- Vitamin E (tocopherols): primary fat-soluble antioxidant; its consumption rate accelerates as lipid oxidation proceeds, meaning that high-aw or high-temperature storage depletes vitamin E while simultaneously increasing rancidity
- B vitamins (thiamine, riboflavin): thiamine is particularly heat- and moisture-sensitive; degradation accelerates above aw 0.65 and above 25°C storage temperature
- Practical consequence: feed manufacturers commonly over-formulate vitamins (particularly A and E) to compensate for expected storage losses; aw management reduces over-formulation cost by extending vitamin stability throughout shelf life
4.4 Enzymatic Reactions and Texture Changes
Residual enzyme activity in feed—from both endogenous grain enzymes and supplemental enzyme premixes—depends on water availability. At aw > 0.60, enzyme-substrate reactions proceed at increasing rates:
- Phytase activity in feed pellets: continues post-pelleting at elevated aw, potentially reducing available phosphorus below formulated levels before the feed is consumed
- Protease activity: can degrade protein quality markers; accelerated at aw > 0.65 and temperatures above 25°C
- Physical texture changes (caking and hardening): driven by moisture migration and phase transitions in the feed matrix; crystallisation of amorphous components (sugars, lactose in dairy-containing feeds) occurs when aw fluctuates across the glass transition threshold
| Degradation Reaction | aw Range of Maximum Rate | Temperature Sensitivity | Primary Affected Nutrients/Quality |
| Lipid oxidation (rancidity) | Very low (< 0.20) and high (> 0.60) | High — doubles rate per 10°C rise | Fat-soluble vitamins; palatability; energy value |
| Maillard browning | 0.40–0.80 (intermediate) | Very high — major accelerant | Available lysine; colour; flavour; palatability |
| Vitamin A degradation | > 0.40 (accelerated by O₂) | Moderate | Vitamin A potency; immune function support |
| Vitamin E degradation | Correlates with lipid oxidation | High | Antioxidant status; reproductive performance |
| Enzyme activity (phytase, protease) | 0.60–0.85 | High | Available phosphorus; digestible protein |
| Caking / texture change | Variable (near glass transition) | Moderate | Physical quality; flow properties; bag integrity |
Table 3. Chemical and physical degradation reactions: aw range of maximum rate and primary quality impacts.
5. Moisture Migration and Packaging: aw Dynamics During Storage
Even when feed exits production within the target aw range, it continues to exchange moisture with its storage environment throughout the shelf-life period. Understanding and controlling this post-production moisture dynamics is as important as achieving the correct aw at manufacture.
5.1 The Equilibrium Principle
Water activity is the equilibrium relative humidity of the feed expressed as a decimal. This thermodynamic identity means that feed will always tend toward moisture equilibrium with its storage environment:
- If storage relative humidity (RH) > feed aw × 100: the feed absorbs moisture from the air until equilibrium is reached—driving aw upward toward the microbial risk threshold
- If storage RH < feed aw × 100: the feed loses moisture to the air—decreasing aw and reducing saleable weight
- Example: feed at aw 0.60 stored in a warehouse at 70% RH will absorb moisture until its aw rises toward 0.70. If the feed has a steep sorption isotherm at this aw, even this small increase in aw may correspond to a 1–2% increase in MC
This equilibrium-seeking behaviour means that shelf life cannot be fixed purely at manufacture—it requires compatible storage conditions throughout the entire distribution chain.
5.2 Moisture Migration Within Packaging
Within a sealed bag, moisture migration occurs even without external humidity exchange. Temperature gradients between the centre and surface of the bag drive moisture movement: warm, moist product interior drives vapour toward cooler surfaces where it condenses. This creates localised zones of elevated aw on the bag inner surface and at the top of the bag (where temperature is typically lowest), promoting localised mould growth even when the bulk product is within specification.
Contributing factors:
- Warm product bagged before adequate cooling (insufficient cooler retention time)
- Diurnal temperature cycling in tropical warehouses
- Multi-component feeds where different ingredients have different aw values; water migrates from high-aw to low-aw components until equilibrium is reached, potentially raising aw of previously safe ingredients
5.3 Packaging Permeability and Water Vapour Transmission Rate (WVTR)
The rate at which a packaged feed approaches equilibrium with its storage environment is governed by the water vapour transmission rate (WVTR) of the packaging material. Lower WVTR means better moisture barrier performance and slower aw drift during storage:
- Standard woven polypropylene (PP) bags: high WVTR; minimal moisture barrier; aw equilibration with ambient air occurs within days to weeks
- Multi-layer laminated bags (PP + polyethylene liner + aluminium foil): very low WVTR; effective moisture barrier; aw equilibration slowed from weeks to months
- Kraft paper + PE-lined bags: intermediate WVTR; common for compound livestock feeds; provides moderate moisture protection
- Published shelf-life model (amaranth-sorghum complementary food, PMC 2020): packaging A (aluminium foil composite) provided shelf life of 1,432 days at 25°C for initial MC of 5 g/100 g, vs. substantially shorter shelf life with paper-based packaging K and KL at the same initial MC and storage temperature
- Temperature sensitivity of packaging A: shelf life reduction of 65.2% when storage temperature increased from 25°C to 35°C for the aluminium foil composite, demonstrating that barrier packaging cannot fully compensate for poor temperature control in tropical environments
Practical guidance: high-barrier packaging is most beneficial in tropical, humid climates (high ambient RH driving moisture ingress) and for high-value, high-fat, or long-shelf-life feeds. For short shelf-life, temperate-climate compound feeds, the incremental cost of moisture-barrier packaging may not be justified if temperature-controlled warehousing is available.
5.4 Shelf Life by Feed Category
| Feed Category | Typical Shelf Life (unopened) | aw Target | Primary Limiting Factor | Packaging Recommendation |
| Dry compound livestock feed | 3–6 months | ≤ 0.70 | Mould; Maillard browning | PP woven + inner PE liner |
| Dry poultry starter (crumble) | 2–4 months | ≤ 0.65 | Mould; fat oxidation | Multi-layer; PE-lined minimum |
| Dry pet food (kibble) | 12–18 months | ≤ 0.60 | Lipid oxidation; mould after opening | Multi-layer barrier; resealable |
| Semi-moist pet treats | 6–12 months | 0.60–0.75 | Mould; yeast; texture change | Vacuum or modified atmosphere; high barrier |
| Aqua-feed (floating pellet) | 3–6 months | ≤ 0.60 | Lipid oxidation; moisture ingress | Moisture-barrier; dry storage essential |
| Medicated premix feed | 1–3 months | ≤ 0.60 | Active ingredient stability; moisture | Sealed, desiccant-included packaging |
| Wet / canned feed | 12–36 months (sealed can) | 0.90–0.99 | Requires hermetic seal + Fo value | Hermetically sealed can or retort pouch |
Table 4. Shelf life targets by feed category, primary limiting factor, and packaging recommendation.
6. Shelf-Life Prediction: The aw-Based Approach
Traditional feed quality specifications set fixed MC limits (e.g., ≤ 13%) without accounting for formulation-specific aw–MC relationships, packaging permeability, or storage conditions. aw-based shelf life prediction is a more rigorous approach that integrates these factors to estimate actual shelf life under defined storage conditions.
6.1 Moisture Sorption Isotherm Modelling
Shelf-life prediction from sorption isotherms involves five steps:
- Step 1: Measure the moisture sorption isotherm of the specific feed formulation at the expected storage temperature(s) using a water activity meter and a series of reference humidity solutions
- Step 2: Determine the critical aw value at which the first shelf-life failure mode (mould, rancidity, browning) will occur for that product
- Step 3: Measure the WVTR of the proposed packaging material under the expected storage conditions
- Step 4: Using Fickian diffusion mathematics, calculate the time required for the packaged feed to reach the critical aw when exposed to the expected storage ambient RH and temperature
- Step 5: Set the shelf-life claim at a fraction of the predicted time (typically 70–80%) to account for variability in storage conditions and production variability
This approach was validated in the amaranth-sorghum food shelf life study (PMC 2020), where predicted and measured shelf life aligned closely when packaging permeability and isotherm data were accurately characterised. Applied to animal feed, it enables manufacturers to scientifically justify shelf-life claims rather than setting them empirically.
6.2 Accelerated Shelf Life Testing (ASLT)
Real-time shelf life testing (storing product at target conditions and testing periodically) requires months or years for long-shelf-life feeds. Accelerated shelf life testing stores product at elevated temperature (typically 35–45°C) to compress the chemical reaction timeline:
- Temperature acceleration factor: the Q10 rule states that for every 10°C increase in temperature, chemical reaction rates approximately double. A product stored at 40°C ages approximately 4× faster than at 20°C
- Microbial acceleration: microbial growth rate also increases with temperature (within pathogen temperature ranges), enabling faster assessment of mould risk at elevated aw
- ASLT protocol for compound feed: store samples at 35–45°C; pull samples every 30, 60, and 90 days for aw, MC, mould count, PDI, lipid oxidation (peroxide value/TBARS), vitamin content, and palatability testing (where applicable)
- Limitation: ASLT does not accurately predict shelf-life failure modes that change qualitatively with temperature (e.g., crystal phase transitions, protein denaturation thresholds)
| Shelf-Life Test Parameter | Measurement Method | Critical Limit | Failure Mode Indicated |
| Water activity (aw) | Chilled mirror dew-point; capacitance sensor | Increase above 0.70 | Moisture ingress; mould risk |
| Moisture content (MC) | Loss on Drying (LOD) at 105°C; NIR | Increase > 0.5% from initial | Packaging failure; moisture ingress |
| Mould count (CFU/g) | ISO 21527 dilution plate count | ≥ 10⁴ CFU/g (species-dependent) | Active mould growth; approaching mycotoxin risk |
| Lipid oxidation (TBARS/PV) | Thiobarbituric acid reactive substances | PV > 5 meq O₂/kg; TBARS trend | Rancidity; palatability loss; vitamin E depletion |
| Available lysine | AOAC 975.44 reactive lysine assay | > 10% reduction from initial | Maillard browning; protein quality loss |
| Vitamin A potency | HPLC (AOAC 2001.13) | < 80% of label claim | Vitamin A degradation |
| PDI / pellet hardness | ASAE S269.4 tumbling box; hardness tester | PDI < 85% or significant softening | Moisture-induced structural weakening |
Table 5. Recommended shelf-life testing parameters, methods, critical limits, and failure modes.
7. Control Strategies for Shelf-Life Optimisation
Effective shelf-life management requires interventions across four domains: process design, additive technology, packaging selection, and storage management. These are complementary—no single intervention is sufficient on its own.
7.1 Process Design: Achieving Target aw at Manufacture
The foundation of shelf-life management is producing finished feed consistently within the target aw range (≤ 0.70; preferred ≤ 0.65):
- Steam quality control: saturated dry steam at the conditioner distributes moisture as bound moisture within particle interiors; wet steam deposits free surface water, raising aw without improving pellet quality
- Cooling optimisation: counterflow coolers should reduce hot pellet MC (17–18%) to finished pellet MC (12–13%) uniformly; over-cooling produces brittle pellets and sacrifices yield; under-cooling leaves surface moisture that raises aw and promotes condensation in packaging
- In-line aw monitoring: aw sensors (chilled mirror dew-point instruments) deployed at the cooler discharge enable real-time verification that finished product meets aw specification before bagging
- Incoming raw material MC control: NIR sensors at raw material intake document lot-by-lot MC variability, enabling recipe-level adjustment before moisture problems propagate through the production system
7.2 Antifungal Additives and Mould Inhibitors
Antifungal additives extend shelf life by directly inhibiting mould growth and reducing aw, providing a chemical barrier that supplements physical aw control:
- Propionic acid and its salts (ammonium propionate, calcium propionate): the most widely used antifungal in compound feed. Propionic acid inhibits mould cell membrane integrity at concentrations achievable at standard inclusion rates. Free acid form is most effective but volatile; buffered/esterified forms provide longer-lasting protection
- Formic acid (buffered): effective bactericide and antifungal, particularly against Salmonella and E. coli; often combined with propionic acid
- Glycerol esters of propionic acid: esterified propionic acid combined with glycerol humectant. The ester bond is more stable than propionic acid salts, providing longer-lasting antifungal protection. The glycerol fraction simultaneously acts as a humectant, binding free water and reducing aw. Commercial 8-mill meta-analysis data show aw maintained at 0.64 with 12.4% MC, with Enterobacteriaceae below 2,400 CFU/g in moisture-challenged feed
- Sorbic acid / potassium sorbate: effective against moulds and yeasts at aw 0.65–0.80; particularly useful in semi-moist feeds where propionic acid volatility limits effectiveness
- Organic acid blend efficacy: the combination of propionic acid + formic acid typically provides broader spectrum protection than either acid alone, and at lower individual inclusion rates
7.3 Humectants for aw Depression
Humectants bind free water within the feed matrix, reducing aw at the same total MC. They are particularly valuable for semi-moist and intermediate-moisture feeds where higher MC is required for texture and palatability but aw must be controlled:
- Glycerol (glycerin): triol with strong hygroscopic character; capable of holding up to 1,000 times its own weight in water via hydrogen bonding. Reduces aw by converting free surface water to matrix-bound water. Used in semi-moist pet food to maintain soft texture at controlled aw
- Propylene glycol: humectant used in some semi-moist feeds; more limited in animal feed applications than glycerol due to species-specific safety considerations (cats are particularly sensitive)
- Salt (NaCl) and sugars (sucrose, glucose): ionic solutes that depress aw through the Raoult effect (colligative aw depression). Common in human food shelf-life management; limited use in compound feeds due to palatability and nutritional constraints
7.4 Packaging Selection
Packaging is the physical barrier between the finished feed and the storage environment. For shelf-life management, the key packaging properties are:
- Water vapour transmission rate (WVTR): primary indicator of moisture-barrier performance. Lower WVTR = slower aw drift during storage = longer effective shelf life at a given initial aw. Multi-layer PP/PE/aluminium laminate bags provide WVTR values 10–100× lower than standard woven PP bags
- Oxygen transmission rate (OTR): relevant for high-fat feeds where lipid oxidation is the shelf-life limiting factor. Oxygen-barrier packaging (aluminium foil, EVOH-containing laminates) significantly extends shelf life for aqua-feeds, high-fat pet food, and fat-coated poultry feeds
- Reclosable / resealable formats: for retail pet food and specialty animal feeds, resealable zippers or valve closures significantly reduce moisture exposure after first opening—a major determinant of in-home shelf life
- Desiccant sachets: silica gel, molecular sieves, or activated clay sachets can be included in sealed packaging to absorb moisture released from the product during temperature cycling, further extending shelf life for moisture-sensitive products
7.5 Storage Management
Even perfect aw control at manufacture and ideal packaging permeability cannot prevent shelf-life failure if storage conditions are inappropriate:
- Temperature control: every 10°C reduction in storage temperature approximately halves the rate of chemical degradation reactions. Cool, dry warehousing (< 25°C) is the single most impactful storage management intervention for feed shelf life
- Relative humidity control: warehouse RH > 70% drives moisture ingress through all but the most impermeable packaging. RH ≤ 60% is the recommended warehouse target; dehumidification is justified for high-value or long-shelf-life feeds in tropical climates
- First-in-first-out (FIFO) rotation: strictly enforced FIFO prevents older product accumulating at the back of warehouses; even well-packaged feed accumulates chemical degradation over time
- Pallet stacking height: limiting to ≤ 10 bags reduces compressive load on base-layer bags, minimising bag damage and reducing the risk of seal failure that accelerates moisture ingress
- Avoidance of direct sunlight: UV radiation accelerates lipid oxidation and vitamin A/E degradation. Internal warehouse storage away from windows and skylights is required for vitamin-sensitive feeds
8. Regulatory Framework
Feed moisture and water activity are subject to regulatory specification in major markets:
- EU Feed Hygiene Regulation (EC No 183/2005): requires HACCP-based procedures with moisture management as a Critical Control Point (CCP); manufacturers must demonstrate that finished feed MC and aw are routinely within safe limits
- US FDA (21 CFR Parts 108, 113, 114): aw ≤ 0.85 is the regulatory threshold for ‘potentially hazardous’ food; the same principle applies under FDA’s Preventive Controls for Animal Food rule (21 CFR Part 507, FSMA). Facilities must document preventive controls for moisture as a physical hazard
- AAFCO (Association of American Feed Control Officials): maximum MC limits for specific feed categories (e.g., ≤ 12% for dry dog food); MC determination methods specified as Loss on Drying (AOAC 930.15) or Karl Fischer Titration (AOAC 2001.12)
- European pet food standard (FEDIAF guidelines): MC limits for dry pet food typically ≤ 12%; aw testing recommended as a supplementary quality indicator
- Canada (CFIA): management practices for mycotoxin prevention specify maintaining grain MC below equivalent to aw 0.70 (< 14.5% MC by weight) as the primary prevention measure
- China (GB 13078-2017): maximum aflatoxin B1 limits in feed ingredients; complementary MC limits for stored grain reinforced by national grain storage standards
9. Conclusions and Key Recommendations
The relationship between feed moisture, water activity, and shelf life is complex, non-linear, and product-specific—but it is governed by well-established scientific principles that provide a rigorous basis for technical decision-making. This report has demonstrated:
- MC and aw measure different things and must both be managed: MC determines yield; aw determines shelf-life safety. A feed can be within MC specification but exceed the aw threshold for mould growth; or within aw specification but below the MC needed for adequate pellet quality.
- aw 0.70 is the critical safety boundary for dry animal feed: maintaining finished feed aw ≤ 0.70 inhibits all common bacterial pathogens and most moulds. Maintaining aw ≤ 0.65 provides additional safety margin against xerotolerant species and is the preferred target for tropical climates or feeds with shelf lives exceeding 3 months.
- aw 0.80 is the mycotoxin production threshold: most mycotoxigenic moulds cannot produce toxins below aw 0.85; maintaining finished feed aw ≤ 0.70 provides an absolute barrier against in-storage mycotoxin synthesis even in the presence of mould spores.
- Chemical degradation continues below the microbial threshold: lipid oxidation (particularly at very low aw in high-fat feeds), Maillard browning (maximised at aw 0.40–0.80), and vitamin degradation must be managed through antioxidants, aw control near the monolayer optimum, temperature reduction, and oxygen-barrier packaging.
- The MC–aw relationship is non-linear and product-specific: moisture sorption isotherms are essential tools for feed manufacturers, enabling science-based specification of MC limits, packaging selection, and shelf-life claims for each specific formulation.
- Storage conditions drive post-production aw dynamics: feed will always tend toward equilibrium with its storage environment. Packaging permeability and warehouse RH/temperature control are as important as production aw targets in determining actual shelf life delivered to the customer.
- Antifungal additives (organic acids, glycerol esters) and humectants (glycerol) provide chemical control of aw and mould growth to extend shelf life beyond what process control alone can achieve.
Recommended immediate actions for technical personnel:
- Action 1: Measure aw (not just MC) on finished feed using a calibrated chilled mirror or capacitance water activity meter. If aw measurement is not currently part of the quality system, implement it immediately as a release criterion alongside MC
- Action 2: Determine the moisture sorption isotherm of each major feed formulation at 25°C and 35°C to understand the MC–aw relationship specific to each product
- Action 3: Map the aw of storage warehouse conditions seasonally; if ambient RH exceeds 70% in peak humidity season, evaluate moisture-barrier packaging upgrades or dehumidification
- Action 4: Verify antifungal additive inclusion rates are sufficient for the target shelf life and climate; consider glycerol ester products for simultaneous aw depression and mould inhibition
- Action 5: Implement accelerated shelf life testing (35–45°C, 30/60/90-day pull points) for each product formulation to establish evidence-based shelf-life claims
References and Data Sources
- Alltech (2025). 2025 Alltech Agri-Food Outlook — Global compound feed production data from 28,235 mills, 142 countries.
- IRIS Engineering (2024). Water Activity Analysis in Animal Feed with Visum Palm. iris-eng.com
- Feed & Additive Magazine (2021). 10 takeaways from a mini-course on managing moisture and water activity (Trouw Nutrition / METER Group). feedandadditive.com
- SR Publications (2025). Moisture as a Critical Determinant of Feed Hygiene and Safety. srpublication.com
- Neutec Group / BSM Partners (2024). Shelf Life Simplified: A Water Activity Based Approach. neutecgroup.com
- Neutec Group (2024). Is Water Activity the Most Important Pet Food Specification? neutecgroup.com
- BSM Partners (2025). Preserving Quality: Understanding Shelf Life in Pet Food. bsmpartners.net
- Manitoba Agriculture (CFIA). Mycotoxins — aw and moisture management. gov.mb.ca
- SpringerLink (1985). Effect of Water Activity on Mold Growth and Mycotoxin Production. Richard-Molard, Lesage, Cahagnier. doi.org/10.1007/978-94-009-5103-7_17
- ScienceDirect / Journal of Food Protection (2013). Low-Water Activity Foods: Increased Concern as Vehicles of Foodborne Pathogens. doi.org/10.4315
- PMC / NCBI (2020). Molecular Aspects of Mycotoxins — A Serious Problem for Human Health. PMC7662353
- PMC / NCBI (2022). Impacts of Temperature and Water Activity Interactions on Growth and AFB1 Production in Aspergillus flavus Isolates. PMC10222184
- PMC / NCBI (2025). Fungal Contamination of Dairy Feed and Major Mycotoxin Transfer: A Risk Evaluation. PMC12845934
- PMC / NCBI (2018). Influence of Temperature and Water Activity on Deleterious Fungi and Mycotoxin Production during Grain Storage. PMC5780356
- Agriculture.Institute (2025). Equilibrium Moisture Content: Key to Food Preservation. agriculture.institute
- Agriculture.Institute (2025). Water Sorption Isotherms: Key to Food Preservation. agriculture.institute
- IntechOpen (2020). Moisture Sorption Isotherms and Isotherm Model Performance Evaluation for Food and Agricultural Products. intechopen.com
- PMC / NCBI (2020). Moisture sorption isotherm and shelf life prediction of complementary food (amaranth-sorghum). PMC7026356
- PMC / NCBI (2022). Seed Moisture Isotherms, Sorption Models, and Longevity. PMC9201756
- PMC / NCBI (2019). Effects of Storage Time and Temperature on Lipid Oxidation and Protein Co-Oxidation of Low-Moisture Shredded Meat Products. PMC6827159
- NCBI / PMC (2023). The Use of Predictive Microbiology for the Prediction of the Shelf Life of Food Products. PMC10743123
- Korean J Food Sci Anim Resour (2025). Effects of Temperature on the Microbial Growth and Quality of Unsealed Dry Pet Food during Storage. kosfaj.org
- United Food Labs (2025). How Shelf Life Testing Works for Pet Food and Animal Products. unitedfoodlabs.com
- AQUALAB by Addium. Pet Food Moisture and Water Activity. aqualab.com
- US FDA. 21 CFR Parts 108, 113, 114 — Water Activity in Food. fda.gov
- US FDA. 21 CFR Part 507 — Preventive Controls for Animal Food (FSMA). fda.gov