
 +86 18574103366
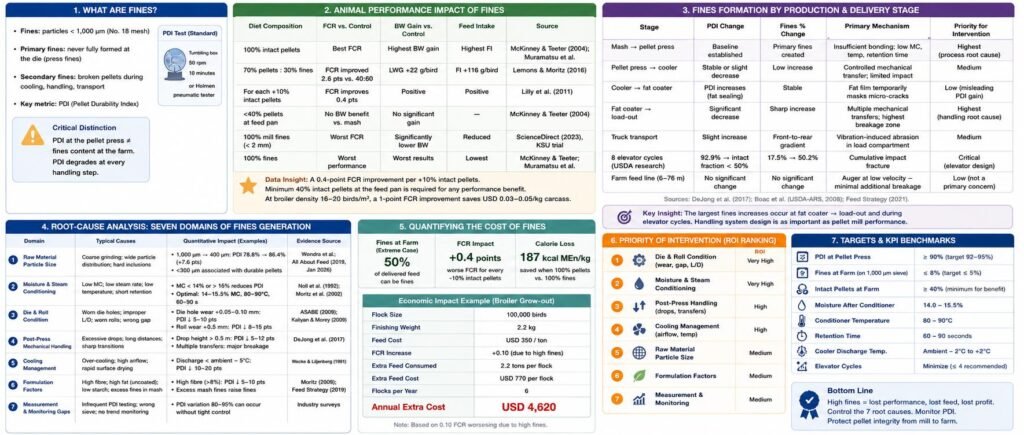
Excessive fines in pelleted animal feed represent one of the most commercially damaging and operationally complex quality failures in feed manufacturing. Fines reduce saleable pellet yield, cause nutrient segregation between pellets and fine particles, impair animal performance, generate customer complaints, and drive reprocessing costs. In extreme cases, the proportion of fines at the farm can reach 50% of delivered feed, negating the performance benefits of pelleting entirely.
This report provides a comprehensive analysis of the causes of high fines in pellet feed production, organised as a root-cause framework spanning seven domains: (1) raw material composition and particle size, (2) moisture and steam conditioning deficiencies, (3) die and roll equipment condition, (4) post-press mechanical handling, (5) cooling management, (6) formulation factors, and (7) measurement and monitoring gaps. Each domain is supported by quantitative data from peer-reviewed studies and commercial mill analyses. A dedicated data analysis chapter quantifies the animal performance cost of excess fines and the magnitude of each process variable’s contribution to PDI loss. The report concludes with a prioritised diagnostic and remediation framework for technical personnel.
1. Introduction: Why Fines Matter
1.1 Definition and Measurement
Feed fines are particles smaller than the nominal pellet diameter that are present in a batch of pelleted feed. They arise from two primary sources: (a) pellets that were never fully formed at the die (press fines, also called ‘primary fines’), and (b) intact pellets that subsequently break during cooling, handling, conveying, bagging, or transport (‘secondary fines’). In commercial practice, fines are quantified by sieving samples through a standardised mesh:
- Standard sieve for fines isolation: 1,000 µm (No. 18 mesh) — particles passing through this sieve are classified as fines
- Optional oversized sieve: 2,800 µm (No. 7 mesh) — used to identify oversized crumbles
- PDI (Pellet Durability Index) is the primary upstream quality metric: expressed as the percentage of intact pellets surviving a standardised mechanical stress test (tumbling box at 50 rpm for 10 minutes, or Holmen pneumatic tester)
- Critical distinction: PDI measured at the pellet press does not equal fines content at the farm; PDI degrades at every subsequent handling step
1.2 Commercial Impact of Fines
The commercial cost of excessive fines operates on three levels simultaneously:
- Direct yield loss: fines are unsaleable as pellets; they must be recycled (at energy and production cost) or discarded
- Animal performance degradation: fines in the feed pan reduce feed intake, worsen FCR, and cause nutrient segregation
- Customer complaints and brand damage: visible fines are the most common physical quality complaint received by commercial feed mills
The animal performance impact of fines is extensively documented. Lilly et al. (2011) reported a 0.4-point FCR improvement for every 10-percentage-point increase in intact pellets in broiler diets. Lemons and Moritz (2016) documented a 2.6-point FCR improvement and 22 g/bird increased live weight gain when broilers consumed 70% pellets : 30% fines versus 40% pellets : 60% fines. McKinney and Teeter (2004) established that a minimum of 40% intact pellets must be present at the feed pan to generate any body weight benefit over mash feed—and confirmed that broilers consuming 100% pellets spared up to 187 kcal MEn/kg of feed compared to 100% fines.
| Diet Composition | FCR vs. Control | BW Gain vs. Control | Feed Intake | Source |
| 100% intact pellets | Best FCR | Highest BW gain | Highest FI | McKinney & Teeter (2004); Muramatsu et al. |
| 70% pellets : 30% fines | FCR improved 2.6 pts vs. 40:60 | LWG +22 g/bird | FI +116 g/bird | Lemons & Moritz (2016) |
| For each +10% intact pellets | FCR improves 0.4 pts | Positive | Positive | Lilly et al. (2011) |
| <40% pellets at feed pan | No BW benefit vs. mash | No significant gain | — | McKinney & Teeter (2004) |
| 100% mill fines (< 2 mm) | Worst FCR | Significantly lower BW | Reduced | ScienceDirect (2023), KSU trial |
| 100% fines | Worst performance | Worst results | Lowest | McKinney & Teeter; Muramatsu et al. |
Table 1. Animal performance (FCR, BW gain, feed intake) as a function of pellet-to-fines ratio in broiler diets. Sources: McKinney & Teeter (2004); Lilly et al. (2011); Lemons & Moritz (2016); ScienceDirect (2023).
Data Insight: The 0.4-point FCR improvement per 10% increase in intact pellets, combined with a minimum threshold of 40% intact pellets for any performance benefit, creates a practical decision boundary: mills delivering feed with less than 40% intact pellets to the feed pan are providing zero pelleting benefit to the animal. At commercial broiler densities of 16–20 birds/m², even a 1-point FCR improvement across a 63-day grow-out can generate USD 0.03–0.05/kg carcass in production savings. This makes fines control a direct driver of producer profitability—not merely a cosmetic quality metric.
2. The Fines Journey: Where Fines Are Created
Understanding where fines are created is prerequisite to controlling them. Fines originate at multiple points in the production and delivery chain, and the relative contribution of each point varies by mill configuration. The DeJong et al. (2017, Kansas State University) commercial mill tracking study is the most comprehensive published dataset on fines formation by stage:
- PDI was measured from the pellet mill through the fat coater, to truck load-out, and finally at the farm feed line
- Key finding 1: PDI increased from the pellet mill to the fat coater—post-pellet fat application temporarily seals surface micro-cracks, improving measured PDI
- Key finding 2: PDI then decreased significantly between the fat coater and load-out—indicating the post-fat-coating handling system is the primary fines-generation zone in this mill
- Key finding 3: percentage fines were similar from pellet mill through cooler, but increased sharply at the fat coater and at load-out
- Key finding 4: fines tended to increase from the front to the rear compartment of the feed truck during transport, but feed line location (6, 35, and 76 m from the bin) had no significant effect
Feed Strategy (2021) confirmed: in extreme cases, fines can reach 50% of delivered feed at the farm. Boac, Casada, and Maghirang (USDA-ARS, 2008) established through repeated bucket elevator cycling that pellets with 92.9% initial PDI saw the proportion of particles below 5.6 mm increase from 17.5% to 50.2% after 8 elevator cycles—demonstrating that even well-produced pellets can degrade catastrophically through handling system design failures.
| Production Stage | PDI Change | Fines % Change | Primary Mechanism | Priority for Intervention |
| Mash → pellet press | Baseline established | Primary fines created | Insufficient bonding: low MC, temp, retention time | Highest — process root cause |
| Pellet press → cooler | Stable or slight decrease | Low increase | Controlled mechanical transfer; limited impact | Medium |
| Cooler → fat coater | PDI increases (fat sealing) | Stable | Fat film temporarily masks micro-cracks | Low (misleading PDI gain) |
| Fat coater → load-out | Significant decrease | Sharp increase | Multiple mechanical transfers; highest breakage zone | Highest — handling root cause |
| Truck transport | Slight increase | Front-to-rear gradient | Vibration-induced abrasion in load compartment | Medium |
| 8 elevator cycles (USDA research) | 92.9% → intact fraction < 50% | 17.5% → 50.2% | Cumulative impact fracture | Critical — elevator design issue |
| Farm feed line (6–76 m) | No significant change | No significant change | Auger at low velocity — minimal additional breakage | Low — not a primary concern |
Table 2. Fines formation by production and delivery stage. Sources: DeJong et al. (2017); Boac et al. (USDA-ARS, 2008); Feed Strategy (2021).
3. Root-Cause Analysis: Seven Domains of Fines Generation
3.1 Domain 1 — Raw Material Particle Size (Coarse Grinding)
Particle size is the most fundamental determinant of pellet structural integrity. Feed Strategy (2019) and multiple peer-reviewed studies confirm the mechanism: fine particles act as an adhesive matrix between larger structural particles, filling inter-particle voids and maximising contact surface area for starch gelatinisation. Coarse particles remain as discrete hard inclusions that act as internal stress concentrators—crack initiation sites from which fracture propagates under mechanical loading.
Quantitative particle size data:
- PDI improvement from particle size reduction: 1,000 µm → 400 µm: PDI 78.8% → 86.4% (+7.6 percentage points; Wondra et al.)
- Particles below 300 µm: consistently associated with ‘high-quality, durable pellet’ across species (All About Feed, Jan 2026)
- Particle size accounts for approximately 20% of pellet quality variation (Aviagen technical reference)
- Muramatsu multi-factor model: particle size (743 vs. 1,041 µm) was a significant PDI variable, though heat processing accounted for the largest share (44%) of total PDI variability
- Feed Strategy (2019) mechanism detail: coarse particles require more time for heat and moisture to penetrate to the particle core during conditioning; under-conditioned particle cores do not gelatinise starch and become fracture initiation sites in the finished pellet
Data Analysis: The 7.6 PDI-point gain from reducing particle size from 1,000 to 400 µm is achieved with zero ongoing additive cost—only a change in hammer mill screen aperture. For a mill running PDI at 83–85%, this single adjustment may be sufficient to breach the 90% PDI target. The risk: finer grinding increases moisture loss during grinding (0.5–1.5% MC loss per stage) and increases specific energy consumption. The optimal particle size is therefore species- and diet-specific, and must be validated against both PDI outcomes and grinding energy data.
3.2 Domain 2 — Moisture and Steam Conditioning Deficiencies
Insufficient mash moisture at the conditioning stage is the single most impactful process cause of fines. The mechanism is direct: without adequate moisture, starch gelatinisation is incomplete, inter-particle liquid bridges do not form, and the solid bridges that provide pellet hardness after cooling are weak or absent.
Quantitative data on moisture deficiency and fines:
- PDI comparison: high moisture mash (927 g/kg DM) vs. low moisture (853 g/kg DM) at the same conditioning temperature: 82.2% vs. 56.5% PDI—a 25.7 percentage-point gap (Moritz et al.)
- Conditioning temperature effect: PDI increases linearly from 87% at 54°C to 92% at 71°C (+5 pp for +17°C; Wecker et al., 2020)
- Critical interaction: temperature alone cannot compensate for moisture deficit—both must be simultaneously optimal
- Wet steam penalty: ‘wet’ steam (carrying condensate) has lower heat transfer efficiency than saturated dry steam; it deposits free surface water rather than absorbed bound moisture, reducing starch gelatinisation and increasing die clogging risk (ResearchGate, 2025)
- Retention time data: average PDI improvement of 4.5% from extended conditioner retention time (Briggs et al., 1999); conditioning time > 4 minutes allows moisture to penetrate to particle core (Plattner, 2002)
- 2% mixer water addition with high-wheat diets: significantly decreased conditioning temperature and PDI (p < 0.05; Wecker et al.)—a warning that over-wetting at the mixer can paradoxically reduce pellet quality
Data Analysis: The 25.7 PDI-point moisture gap is the largest single-variable effect quantified in the pellet quality literature. However, the Wecker data add an important nuance: 2% mixer water addition combined with high wheat inclusion actually reduced PDI because excess surface moisture lowered conditioning temperature efficiency. This creates a counterintuitive situation: moisture must be added to the correct point in the process (via steam to the conditioner, not excess water at the mixer) to improve rather than reduce pellet quality. Mills with high fines rates should first audit mash MC at the conditioner inlet—if it is below 12.5%, this is the primary root cause.
3.3 Domain 3 — Die and Roll Equipment Condition
The pellet press die and rolls are wearing components. As they wear, their ability to form well-bonded pellets declines, and fines generation increases. This relationship has been quantified for the first time in published research by the PMC PDI prediction study (2025):
- Cumulative Production (Tonnes) since last die change: exhibited a statistically significant negative relationship with PDI (PMC, 2025)—the more tonnes produced since the last die change, the lower the PDI
- This is the first published quantification of die wear as a PDI predictor in commercial feed mill conditions (per the authors of the PMC study)
- Die L/D (length-to-diameter) ratio: higher L/D provides greater compression and produces denser, more durable pellets; worn dies develop enlarged die holes with effectively reduced L/D—reducing compression and increasing fines
- Roll gap: excessive roll gap (rolls worn away from the die face) means feed receives less mechanical compression before entering die holes, producing softer pellets with higher fines potential
- Roll wear indicator from Feed Strategy: ‘excessive roll wear can lead to lost productivity, increased slippage, and reduced pellet quality’—but many plants still use ‘tonnage produced’ as a replacement trigger rather than direct measurement of roll condition
Data Analysis: Die wear is the most undermonitored cause of fines escalation in commercial feed mills. Because wear is gradual, it rarely triggers an acute quality event—instead it causes a slow drift upward in fines percentage that is often misattributed to formulation changes or raw material variability. The PMC (2025) quantification establishes cumulative production tonnage as a legitimate predictive variable for PDI decline. Mills that track PDI against cumulative tonnes since last die change can identify the mill-specific wear rate and schedule die replacements proactively rather than reactively.
3.4 Domain 4 — Post-Press Mechanical Handling
Post-press handling systems are responsible for converting high-PDI pellets at the press into lower-PDI, higher-fines product at the customer. The DeJong (2017) study identified the handling system between the fat coater and load-out as the primary fines-generation zone in one commercial mill—exceeding the contribution of the pressing process itself.
Specific handling causes of fines:
- Centrifugal bucket elevators: pellets are thrown against the elevator hood at high velocity on discharge—this single event can generate significant fines from an otherwise acceptable PDI
- Screw conveyors: compression of pellets between the screw flight and trough wall is the primary cause of compression-fracture fines; never appropriate for finished pellet handling
- Drop height: free-fall drops onto hard surfaces cause impact fracture; each drop event progressively degrades pellet integrity
- USDA-ARS data: 8 bucket elevator cycles (54.9 m height) increased fines proportion from 17.5% to 50.2% for pellets with 92.9% initial PDI (Boac et al., 2008)
- Feed Strategy (2021): ‘every pellet transfer can decrease durability and increase broken pellet numbers’—the cumulative effect of approximately 10 handling events between die and farm delivery is the compounding mechanism for fines escalation
- Pneumatic conveying: attrition increases exponentially with air velocity (Aarseth, 2004); short-radius bends cause significantly more damage than long-radius bends; critical breakage velocity: 16.1–19.8 m/s
3.5 Domain 5 — Cooling Management
The counterflow cooler affects fines through two distinct mechanisms:
Under-cooling (warm, soft pellets): pellets discharged from the cooler above the target exit temperature (ambient + 5°C) have not completed the conversion from liquid inter-particle bridges to solid bridges. These structurally immature pellets fracture more readily during subsequent conveying and bagging—generating what appears to be handling-system fines but is actually a cooling failure.
Over-cooling (over-dried, brittle pellets): pellets cooled beyond the target MC (below 11% MC) become brittle. Their hardness may be deceptively high on a crush test, but they shatter under the impact loads of conveying and bagging with characteristic fragmentation patterns. Published rule of thumb: each 11°C of temperature reduction removes approximately 1% MC; miscalibrated coolers in dry-climate or seasonal conditions routinely over-dry pellets.
- Counterflow cooler cracking rate reduction vs. shock cooling: > 90% (Pellet-Feed.com)
- Target exit temperature: ≤ ambient + 5°C (for both poultry and ruminant feeds)
- Target finished MC: 12–13%; below 11.5% creates brittle fracture risk; above 13% creates mould risk
3.6 Domain 6 — Formulation Factors
Feed formulation is an upstream cause of fines that is often difficult to modify without nutritional penalty, but understanding its contribution enables realistic expectation-setting and targeted mitigation:
- Fat content: the most consistently documented negative formulation factor. Mixer-added fat at >3% blocks moisture transfer from steam into the mash, prevents starch gelatinisation, and reduces inter-particle bonding. PMC (2025) PDI prediction model regression coefficient for fat: −1.02 to −3.43 PDI units per 1% fat addition
- Acid Detergent Fibre (ADF) content: significant negative PDI association (p < 0.05, PMC 2025); dietary fibre interferes with starch-binding matrix formation
- Heat processing accounts for 44% of PDI variability vs. formulation’s ≤25% (Muramatsu multi-factor study; Engormix review, 2017)—confirming that process parameters outweigh formulation in determining fines outcomes
- Starch content: high-starch ingredients (maize, wheat) contribute natural bonding; low-starch diets (high vegetable protein, high fibre) produce structurally weaker pellets requiring binder supplementation
- Typical poultry diet fat range: 2–5% added fat with total diet fat of 6.5–10% (Aviagen); at this fat level, steam conditioning efficiency is inherently limited and fine grinding becomes more critical
- Species-specific considerations: fish feed and shrimp feed require higher post-conditioning MC (higher than 14–15.5% target for livestock) because water stability requirements are more demanding
3.7 Domain 7 — Measurement and Monitoring Gaps
A significant and frequently underappreciated cause of chronically high fines is the absence of systematic measurement and root-cause attribution. Mills that measure PDI only at the press—or not at all—cannot distinguish process causes from handling causes, cannot detect slow die wear drift, and cannot link fines complaints from farms to specific production batches.
- Measurement gap 1: testing only at the farm or load-out stage masks where in the process fines were generated
- Measurement gap 2: testing only at the press ignores handling system contribution, which the DeJong study confirmed can exceed press contribution
- Measurement gap 3: absence of cumulative die tonnage tracking prevents proactive die replacement scheduling
- Measurement gap 4: absence of in-line MC measurement means conditioning target achievement is unverified and moisture-related fines causes remain unidentified
- Best practice: measure PDI at a minimum of two points—at the press/post-cooler and at the bagging station; the difference between these two measurements is the ‘handling system PDI penalty’ and identifies where intervention resources should be directed
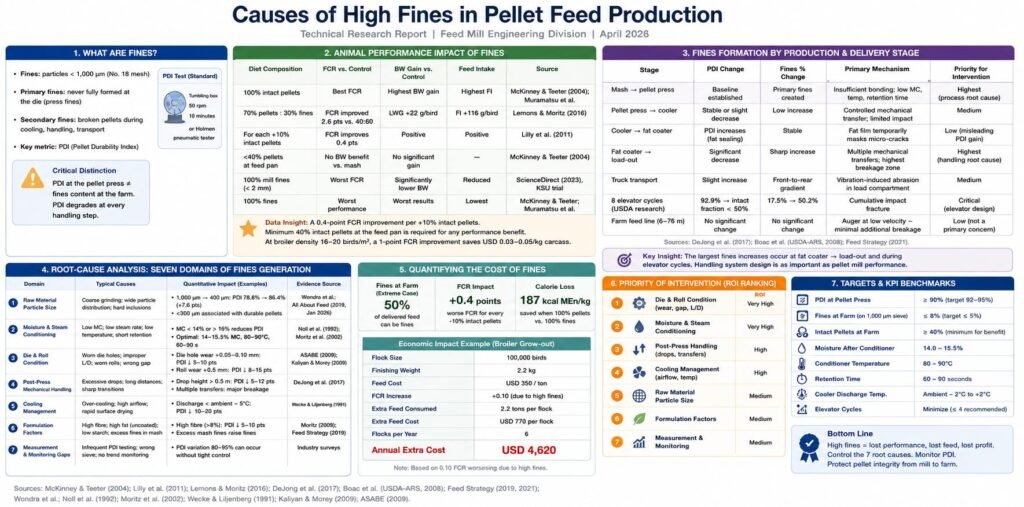
4. Data Analysis: Quantifying Cause Contributions
4.1 Relative Contribution of Major Causes to PDI Variability
Published research allows approximate quantification of each cause category’s contribution to total PDI variability across commercial feed mill populations:
| Cause Category | Contribution to PDI Variability | Primary Data Source | Notes |
| Heat processing (conditioning temperature, steam, retention time) | ~44% of observed PDI variability | Muramatsu study (Engormix, 2017) | Single largest controllable variable; process-level |
| Feed formulation (fat, ADF, starch, protein composition) | ≤25% of observed PDI variability | Multiple researchers consensus | Formulation less controllable than process |
| Particle size and grinding | ~20% of PDI quality | Aviagen technical reference | Interacts strongly with conditioning efficiency |
| Die and roll condition (wear) | Statistically significant negative trend | PMC (2025) — first published quantification | Magnitude increases with cumulative tonnes |
| Handling system (elevators, conveyors, drops) | Variable; can exceed press contribution | DeJong et al. (2017) | Post-fat-coater zone highest in that mill study |
| Cooling management | Significant (under- and over-cooling) | Industry consensus; Benison Media (2021) | Both under- and over-cooling generate fines |
Table 3. Relative contribution of each cause category to PDI variability. Sources: Muramatsu (Engormix); Aviagen; PMC (2025); DeJong et al. (2017).
Data Analysis — The 44%/25%/20% Rule: The three quantified cause categories (heat processing 44%, formulation ≤25%, particle size ~20%) together account for approximately 89% of press-stage PDI variability. This means that for mills with high fines originating at the press, over 80% of the root cause is addressable through process and grinding optimisation—not formulation change. Reformulation to reduce fat or increase starch may be nutritionally unacceptable; process optimisation is the primary lever. Die wear and handling system contributions are additive to these press-stage causes and must be assessed separately using the two-point PDI measurement approach.
4.2 Chemical Composition of Fines vs. Intact Pellets
Fines are not nutritionally identical to the pellets they came from. The DeJong (2017) and Feed Strategy studies both document systematic compositional differences between the fines and pellet fractions from the same batch:
| Nutrient / Parameter | Fines vs. Intact Pellets | Direction | Animal Performance Implication |
| Dry matter (DM) | Greater in fines | Fines higher DM | Marginal; fines are slightly drier |
| Ether extract (crude fat) | Greater in fines | Fines higher fat | Fat segregates to small particles; animals eating primarily fines over-consume fat |
| Acid detergent fibre (ADF) | Greater in fines | Fines higher fibre | Fines are more fibrous; lower energy density |
| Crude protein | Decreased in fines | Fines lower protein | Animals eating primarily fines under-consume protein relative to formulation |
| Starch | Greater in fines (ScienceDirect 2023) | Fines higher starch | Ungelatinised starch fragments from die passage |
| Calcium | Increased in fines (ScienceDirect 2023) | Fines higher calcium | Limestone and mineral particles concentrate in fine fraction |
| Phosphorus | Decreased in fines | Fines lower P | Phosphorus-rich ingredients tend toward larger particle sizes |
Table 4. Chemical composition differences between fines and intact pellets. Sources: DeJong et al. (2017); ScienceDirect (2023).
Data Analysis — The Nutritional Segregation Problem: The compositional data reveal that animals selectively consuming fines receive a diet higher in fat, fibre, starch, and calcium—but lower in protein and phosphorus—compared to the formulated specification. For broilers in the grower and finisher phases, protein under-consumption impairs muscle deposition and body weight gain, directly explaining the FCR penalty documented in the performance literature. The fat enrichment in fines further complicates interpretation: while fat-enriched fines appear energy-dense, the increased fibre content reduces the net energy available. Feed mills should communicate this composition difference to nutritionists when high-fines complaints are received from farms—the solution is rarely reformulation, but rather pellet quality improvement.
4.3 PDI Thresholds and Fines Risk Classification
| PDI at Press | Fines Risk at Farm | Likely Cause Category | Recommended First Action |
| > 95% | Very low (< 2%) | Handling system only; die wear monitoring | Monitor; audit handling system transfer points |
| 90–95% | Low (2–5%) | Minor conditioning or particle size issue | Verify conditioning MC and temperature; check particle size |
| 85–90% | Moderate (5–10%) | Moisture deficit or fat interference | Audit mash MC at conditioner inlet; check fat addition sequence |
| 80–85% | High (10–20%) | Multiple process issues | Full process audit: MC, temperature, retention time, steam quality, grinding |
| < 80% | Very high (> 20%) | Severe process failure or die damage | Stop production; investigate die/roll condition; verify steam supply |
| Varies > 2 pp per shift | Inconsistent; shift-dependent | Process instability (steam pressure, ingredient variability) | Install in-line MC sensor; establish SPC for conditioning parameters |
Table 5. PDI threshold classification, fines risk level, and recommended first diagnostic action.
4.4 Fines Generation per Handling Event
USDA-ARS research (Boac et al., 2008) and industry estimates allow approximate quantification of fines generated per handling event, relative to initial PDI:
| Handling Event | Fines Generated (approx.) | PDI Impact | Notes |
| Each bucket elevator cycle (54.9 m) | ~0.069% of mass per pass (dust) | Cumulative over 8 cycles: intact fraction halved | USDA-ARS Boac et al. (2008) |
| Centrifugal elevator discharge | High — significant single event | Major PDI drop | Never use for finished feed pellets |
| Each screw conveyor pass | High — compression fracture | Major for low-PDI product | Avoid entirely for finished pellet handling |
| Free-fall drop > 300 mm | Moderate — impact fracture | PDI decreases with each drop | Reduce drop height to < 300 mm wherever possible |
| Pneumatic conveying bend (150 mm R) | High — abrasion + impact | Significantly more than long-radius bend | Aarseth (2004): short radius major damage source |
| Pneumatic conveying bend (350 mm R) | Lower than 150 mm R | Substantially less damage | Aarseth: optimal radius range 350–500 mm |
| Belt conveyor (flat, controlled speed) | Very low | Minimal PDI loss | Preferred technology for finished pellet transfer |
| Truck transport (vibration) | Gradual increase front-to-rear | Rear compartment higher fines | DeJong (2017): no effect of farm feed line distance |
Table 6. Approximate fines generation per handling event type and associated PDI impact. Sources: Boac et al. (2008); Aarseth (2004); DeJong et al. (2017).
Data Analysis — Cumulative Handling Damage Model: Across approximately 10 handling events between die and farm (industry estimate), a pellet starting at 92% PDI and losing an average of 1.5 PDI points per major transfer event arrives at the farm at approximately 77% PDI—well below the 85% minimum quality threshold. This arithmetic illustrates why process-level PDI targets must be set higher than the minimum acceptable farm-level PDI: to deliver 85% PDI at the farm, the press must produce at least 90–92% PDI, and the handling system must be optimised to minimise degradation. Mills that set PDI targets at the press equal to the farm delivery standard will always under-deliver.
5. Diagnostic Framework: Root-Cause Attribution
Effective fines management begins with correctly attributing the root cause. The following diagnostic decision tree enables technical personnel to categorise the cause and select targeted interventions:
| Symptom | Likely Domain | Diagnostic Test | Distinguishing Data |
| High fines immediately at press (before cooler) | Process: conditioning / moisture / grinding | Compare PDI at die vs. post-cooler | Fines high both points → press problem |
| Fines low at press, high at load-out | Handling system: elevators, conveyors, drops | Measure PDI at fat coater, then load-out | DeJong: fat coater → load-out is highest-risk zone |
| PDI drifting down over weeks without process change | Die and roll wear | Plot PDI vs. cumulative tonnes since die change | Negative trend confirms die wear (PMC 2025) |
| High fines in specific batches, not all | Ingredient variability / fat addition spike | Correlate with fat inclusion level and ingredient MC | PMC model: fat coefficient −1.02 to −3.43 per 1% |
| Fines high in summer, low in winter | Cooling over-drying (low ambient RH) | Compare finished MC against season | Below 11.5% MC → brittle fracture mechanism |
| Pellets arrive at farm worse than at load-out | Transport vibration / improper truck loading | Measure PDI at load-out and at farm delivery | Front-to-rear gradient in truck (DeJong 2017) |
| High fines despite acceptable PDI number | PDI test method / screen size mismatch | Verify sieve size consistency between mill and farm | 1,000 µm standard vs. non-standard sieves |
Table 7. Diagnostic framework: symptoms, likely root-cause domain, diagnostic test, and distinguishing data.
6. Remediation Strategies by Root Cause
6.1 Process Causes (Conditioning / Moisture / Grinding)
- Increase post-conditioning mash MC to 14.0–15.5%: add atomised hot water at mixer (up to 2% of mash weight) and verify steam quality and pressure
- Raise conditioning temperature to 78–83°C: audit steam supply pressure, separator function, and conditioner thermometer calibration
- Extend conditioning retention time: install double conditioner or expander-conditioner; target ≥ 60 seconds for hydrophobic high-protein diets
- Reduce hammer mill screen aperture: target particle size < 300 µm for poultry; validate against both PDI improvement and MC loss increase
- Relocate fat addition to post-pellet (post-pellet liquid application, PPLA): removes fat-interference with steam conditioning; most effective mitigation for high-fat diet fines
6.2 Die and Roll Equipment
- Implement PDI-vs-cumulative-tonnes tracking: establish mill-specific wear rate curve and schedule preventive die replacement at the PDI inflection point
- Use roll condition monitoring (visual inspection of roll surface profile) as a replacement trigger, not tonnage alone
- Select appropriate die L/D ratio for the formulation: consult press manufacturer for species-specific recommendations
- Pellet binder addition can extend die useful life by reducing friction: calcium lignosulfonate (0.5–1.0%) and glycerol ester products both provide die lubrication
6.3 Handling System
- Replace centrifugal bucket elevators with continuous-discharge (gravity) elevators for all finished pellet handling
- Eliminate or severely restrict screw conveyors for finished product handling; use drag chain conveyors or belt conveyors as alternatives
- Reduce free-fall drop heights to < 300 mm at all transfer points; install curved chute guides and rubber-lined impact absorbers
- For pneumatic systems: reduce air velocity to minimum transport velocity (just above saltation velocity); increase bend radius to ≥ 350 mm
- Install pre-bagging vibratory screen to remove fines that have accumulated across the handling system before product reaches the customer
6.4 Cooling
- Verify exit temperature is ≤ ambient + 5°C on every batch; install continuous temperature monitoring at cooler discharge
- Install variable-speed fan drives (VFDs) to modulate airflow seasonally, preventing over-drying in low-humidity conditions
- Implement automated cooler control system (real-time humidity + temperature feedback to fan speed and retention time)
6.5 Formulation
- Limit mixer-added fat to ≤ 3% of mash weight; apply remaining fat requirement as post-pellet liquid application (PPLA)
- Add pellet binder where formulation constraints produce consistently low PDI: calcium lignosulfonate (0.5–1.0%) or sodium bentonite (1.0–2.5%)
- Ensure starch-rich ingredients (maize, wheat) are included at levels sufficient to provide natural binding; consult nutritionist on reformulation if ADF is driving PDI down
7. Priority Matrix: Interventions Ranked by Evidence and ROI
| Rank | Intervention | Fines Reduction Expected | Evidence Strength | Cost Level | Time to Implement |
| 1 | Two-point PDI measurement (press + bagger) — establishes root cause | Diagnostic — enables all others | High (DeJong 2017; industry consensus) | Low | Immediate |
| 2 | Mash MC audit and conditioning target verification | High — eliminates largest cause (44% of PDI variability) | Highest (Muramatsu; Wecker; Moritz) | Low | Immediate |
| 3 | Particle size reduction (< 400 µm hammer mill screen) | PDI +7.6 pp (Wondra data) | High | Low | 1 week |
| 4 | Replace centrifugal with continuous-discharge bucket elevators | Eliminates major handling breakage zone | High (Boac USDA 2008) | High (capital) | 3–6 months |
| 5 | Relocate fat addition post-pellet (PPLA) | Removes conditioning interference; significant PDI gain | High (Engormix; Phileo) | Medium (equipment) | 1–3 months |
| 6 | PDI vs. cumulative die tonnage tracking + scheduled die replacement | Prevents progressive drift fines escalation | First published: PMC (2025) | Low | Immediate |
| 7 | Extend conditioner retention time (double conditioner / expander) | PDI +4.5% average (Briggs 1999) | High | High (capital) | 6–12 months |
| 8 | Install pre-bagging vibratory screen | Removes accumulated fines before customer delivery | High (direct quality control) | Medium | 1–2 months |
| 9 | Add pellet binder (Ca-lignosulfonate or bentonite) | PDI +6% (bentonite 2.4%); significant high-fat diets | High | Low–Medium | Immediate |
| 10 | Automated cooler control + VFD fans | Eliminates seasonal over-drying brittleness | Medium (system data) | Medium–High | 3–6 months |
Table 8. Fines reduction interventions ranked by evidence strength and ROI. Sources: consolidated from all cited studies.
8. Key Performance Indicators for Fines Management
| KPI | Target / Threshold | Measurement Point | Measurement Frequency |
| PDI at pellet press (post-cooler) | ≥ 90% (target ≥ 92%) | Post-cooler conveyor sample | Every batch / hourly |
| PDI at bagging station | ≥ 88% (target ≥ 90%) | Pre-bagger product stream | Every batch |
| PDI handling loss (press − bagger) | ≤ 2 percentage points | Calculated from above two | Weekly trend |
| Fines % at bagging | ≤ 3% by weight | Pre-bagger screen underflow | Every batch |
| Fines % at farm delivery | ≤ 5% (target ≤ 3%) | Farm pan sample | Weekly customer feedback |
| Post-conditioning MC | 14.0–15.5% | Conditioner discharge (NIR) | Continuous |
| Conditioning temperature | 78–83°C | Conditioner outlet thermometer | Continuous |
| Cooler exit temperature | ≤ Ambient + 5°C | Cooler discharge thermometer | Continuous |
| Finished pellet MC | 12.0–13.0% | Post-cooler (NIR) | Continuous |
| Cumulative die tonnage | Track; replace at PDI inflection | Mill production system | Per batch |
Table 9. KPI targets, measurement points, and frequency for fines management.
9. Conclusions
Excessive fines in pelleted animal feed are a multi-cause problem that must be diagnosed systematically before interventions are selected. This report has established the following principal conclusions:
- Fines have a direct, quantified animal performance cost: the 0.4-point FCR improvement per 10% increase in intact pellets (Lilly et al., 2011) and the 2.6-point FCR improvement from 70:30 vs. 40:60 pellet:fines ratios (Lemons & Moritz, 2016) confirm that fines reduction is a direct driver of producer economics, not merely a cosmetic quality metric.
- Fines are nutritionally different from intact pellets: higher fat, ADF, starch, and calcium; lower protein and phosphorus (DeJong 2017; ScienceDirect 2023). Animals preferentially consuming fines receive a diet that diverges from the nutritional specification, compounding the performance loss.
- Heat processing is the largest single cause (44% of PDI variability), followed by formulation (≤25%) and particle size (~20%): process optimisation has approximately 1.75× more leverage over fines than formulation change, making process audit the first and highest-priority diagnostic step.
- The 25.7 PDI-point gap between high and low moisture mash (82.2% vs. 56.5% PDI; Moritz et al.) is the largest single-variable effect in the literature: any mill with PDI below 85% should audit mash MC at the conditioner inlet as the first diagnostic action.
- Die wear is a statistically confirmed but systematically undermonitored PDI predictor: the PMC (2025) study’s first quantification of cumulative production tonnage as a negative PDI predictor provides the scientific basis for proactive, evidence-based die replacement scheduling.
- The handling system can contribute more fines than the press: the DeJong (2017) study found the largest PDI loss occurred between the fat coater and load-out—not at the press stage. Two-point PDI measurement (press and bagger) is the minimum monitoring system needed to distinguish and prioritise process vs. handling root causes.
- Press PDI targets must exceed farm delivery targets by a margin that accounts for handling system degradation: to deliver ≥ 85% PDI at the farm through approximately 10 handling events, the press must produce at least 90–92% PDI, and the handling system must be engineered to minimise each transfer’s contribution to cumulative PDI loss.
- The highest-ROI first action is measurement, not intervention: implementing two-point PDI tracking costs little and immediately reveals whether root cause lies in the process or the handling system—enabling all subsequent interventions to be correctly targeted.
References and Data Sources
- DeJong, J.A., DeRouchey, J.M. et al. (2017). Formation of Pellet Fines During the Feed Manufacturing Process. Kansas State University Applied Swine Nutrition. asi.k-state.edu
- Boac, J.M., Casada, M.E., Maghirang, R.G. (2008). Feed Pellet and Corn Durability and Breakage During Repeated Elevator Handling. USDA-ARS. ars.usda.gov
- PMC / NCBI (2025). Prediction of Pellet Durability Index in a commercial feed mill using multiple linear regression. J. Anim Sci. 103:skaf021. PMC11914881.
- Muramatsu, K. et al. (2015). Multi-factor PDI variability study (heat processing 44%; particle size; fat; moisture). Referenced in Engormix review (2017) and Phileo by Lesaffre (2022).
- McKinney, L.J. & Teeter, R.G. (2004). Minimum 40% intact pellets threshold for broiler performance benefit; 187 kcal MEn/kg spared at 100% pellets vs. 100% fines.
- Lilly, K.G.S. et al. (2011). 0.4-point FCR improvement per 10-percentage-point increase in intact pellets. Journal of Applied Poultry Research.
- Lemons, M.E. & Moritz, J.S. (2016). 2.6-point FCR improvement: 70% pellets:30% fines vs. 40% pellets:60% fines; LWG +22 g/bird; FI +116 g/bird.
- Glover, B. et al. (2016). 6-point FCR improvement in finisher period: 90:10 vs. 50:50 pellet:fine ratio.
- ScienceDirect (2023). Effects of feeding varying proportions of pellets and fines on growth performance and carcass yield of broilers during a 63-d production period. doi.org/10.1016/j.psj.2023
- Wecker, H.K., Paulk, C.B. et al. (2020). PSI-11 Moisture Content Throughout the Pelleting Process and Subsequent Effects on Pellet Quality. ResearchGate.
- Moritz, J.S. et al. (2002). Feed moisture, retention time, and steam as quality and energy utilisation determinants in the pelleting process. ResearchGate.
- Briggs, J.L. et al. (1999). Conditioning effects on pellet durability — average +4.5% PDI from extended retention time. Poultry Science.
- Plattner, B. (2002). Conditioning time > 4 minutes for uniform moisture penetration. Feed industry reference.
- Aarseth, K.A. (2004). Attrition of Feed Pellets during Pneumatic Conveying: the Influence of Velocity and Bend Radius. Biosystems Engineering 89(2):197–213.
- Engormix (2017). Factors That Affect Pellet Quality: A Review — heat processing 44%, formulation ≤25% of PDI variability. en.engormix.com
- Phileo by Lesaffre (2022). Optimising pellet processing to boost pellet quality and profitability. phileo-lesaffre.com
- Feed Strategy (2021). Practical evaluation of pellet quality — fines up to 50% at farm in extreme cases; measurement methodology. feedstrategy.com