
 +86 18574103366
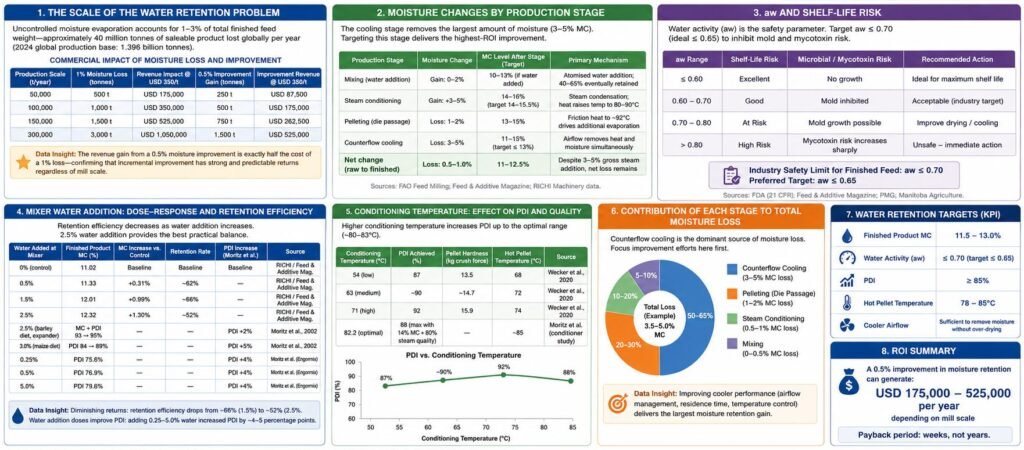
Water retention in feed pellets is a central operational challenge in commercial animal feed manufacturing. Every percentage point of moisture lost between raw material intake and finished pellet represents direct financial loss. Industry-wide, uncontrolled moisture evaporation accounts for 1–3% of total finished feed weight—approximately 40 million tonnes of saleable product lost per year globally (2024 global production base: 1.396 billion metric tonnes). For a single mill producing 100,000 tonnes per year, a 1% moisture loss equates to 1,000 tonnes of unsaleable product.
This report provides a comprehensive analysis of strategies to improve water retention in feed pellets, integrating quantitative data from peer-reviewed experimental trials, commercial mill meta-analyses, and engineering studies. A dedicated data analysis chapter synthesises and interprets the numerical evidence—including the dose–response relationship between mixer water addition and retention efficiency, the PDI impact of conditioning temperature across three experimental levels, the relative contribution of each production stage to total moisture loss, and the commercial performance of moisture retention additive technologies. The report concludes with an evidence-ranked implementation framework.
1. Introduction: The Scale of the Water Retention Problem
Feed pellets lose water at every stage of the manufacturing process. Raw materials enter at an average moisture content (MC) of approximately 10–12% (FAO Feed Milling Processes reference); by the time the finished pellet exits the cooler, MC has typically fallen to 11–13%—a net loss of 0.5–1.0 percentage points despite multiple water-addition steps through conditioning and mixing.
This ‘shrinkage gap’ is not inevitable. It is the consequence of process conditions that favour moisture evaporation over moisture retention. The commercial case for closing this gap is unambiguous: retained moisture in finished feed is saleable weight. The investment case is equally clear: the tools to improve retention—process optimisation, measurement technology, and additive products—carry payback periods measured in weeks, not years.
The goal of this report is not merely to list improvement strategies but to quantify their effects with the data available from published research, so that technical personnel can rank and prioritise interventions on an evidence basis.
| Production Scale (t/year) | 1% Moisture Loss (tonnes) | Revenue Impact @ USD 350/t | 0.5% Improvement Gain (tonnes) | Improvement Revenue @ USD 350/t |
| 50,000 | 500 t | USD 175,000 | 250 t | USD 87,500 |
| 100,000 | 1,000 t | USD 350,000 | 500 t | USD 175,000 |
| 150,000 | 1,500 t | USD 525,000 | 750 t | USD 262,500 |
| 300,000 | 3,000 t | USD 1,050,000 | 1,500 t | USD 525,000 |
Table 1. Commercial impact of moisture loss and improvement gain by mill production scale. Source: Industry calculation based on Feed & Additive Magazine data.
Data Insight: The revenue gain from a 0.5% moisture improvement is exactly half the cost of a 1% loss—confirming that incremental improvement has strong and predictable returns regardless of mill scale. A 300,000 t/year mill investing in comprehensive moisture management can recover USD 525,000 in annual revenue from the same raw material inputs with no headcount addition.
2. Fundamental Concepts: Bound Water, Free Water, and aw
Improving water retention requires understanding that not all moisture in feed behaves the same way. Feed contains two distinct water fractions:
- Bound water: held within the feed particle matrix by hydrogen bonds to proteins, starch, and fibre. Not freely available for evaporation or microbial metabolism. Contributes to pellet structural integrity.
- Free water: mobile, surface-located, or inter-particle water. Evaporates readily during cooling. Raises water activity (aw). Does not contribute to pellet bonding.
The goal of water retention improvement is to maximise bound water—not simply to add more total water. Water added in the mixer or from steam that remains as free surface moisture will largely evaporate during cooling, contributing nothing to pellet quality and potentially raising aw above the safety threshold of 0.70 (target ≤ 0.65).
Water activity (aw) is the critical safety parameter. It measures only the free water fraction available to microorganisms and chemical reactions, on a scale of 0 to 1.0. The industry-accepted safety limit for finished compound feed is aw ≤ 0.70; at aw > 0.70 mould growth becomes possible, and above aw 0.80, mycotoxin production risk increases sharply. Any moisture retention strategy must simultaneously verify that aw remains within safe limits—adding moisture without converting it to bound form will raise aw and create food safety risk.
3. Moisture Loss by Production Stage: Quantifying the Problem
Before improving water retention, it is essential to know where moisture is being lost and in what proportions. The following data allow technical personnel to identify the highest-priority intervention points for their specific mill configuration.
3.1 Moisture Flow Through the Production Line
The FAO Feed Milling reference documents the following moisture transformation sequence under standard operating conditions:
- Incoming mash: approximately 10–12% MC at ambient temperature
- After steam conditioning (within 20 seconds): 15–16% MC at 80–90°C—representing the primary moisture addition point
- After pelleting (die exit): friction raises temperature to nearly 92°C; MC begins declining
- After counterflow cooling (within 10 minutes): dried to below 13% MC at near-ambient temperature
This sequence reveals the fundamental paradox of pellet moisture management: the process adds 3–4% MC during conditioning, then removes most of it during cooling. The net result—finished MC below initial mash MC—occurs because the steam-added moisture is predominantly surface-applied (free water) and evaporates predictably during cooling, while the original bound moisture in the raw material is partially lost to grinding heat and die friction.
| Production Stage | Moisture Change | MC Level After Stage | Primary Mechanism |
| Raw material at intake | Baseline | 10–12% | Variable by ingredient, season, origin |
| Grinding (hammer mill) | Loss: 0.5–1.5% | 9.5–11.5% | Friction heat 45–50°C above ambient drives vapour loss |
| Mixing (water addition) | Gain: 0–2% | 10–13% (if water added) | Atomised water addition; 40–65% eventually retained |
| Steam conditioning | Gain: +3–5% | 14–16% (target 14–15.5%) | Steam condensation; heat raises temp to 80–90°C |
| Pelleting (die passage) | Loss: 1–2% | 13–15% | Friction heat to ~92°C drives additional evaporation |
| Counterflow cooling | Loss: 3–5% | 11–13% (target ≤ 13%) | Airflow removes heat and moisture simultaneously |
| Net change (raw to finished) | Loss: 0.5–1.0% | 11–12.5% | Despite 3–5% gross steam addition, net loss remains |
Table 2. Moisture changes by production stage. Sources: FAO Feed Milling; Feed & Additive Magazine; RICHI Machinery data.
Data Insight: The cooling stage removes 3–5% MC—the largest single moisture removal event in the process—yet it receives less engineering attention than conditioning. This asymmetry represents a significant opportunity: optimising cooler airflow and retention time to remove exactly the right amount of moisture (not more) is one of the highest-ROI interventions available without capital expenditure on additive products.
4. Data Analysis: Key Quantitative Relationships
This chapter synthesises the numerical evidence from published experimental studies and commercial trials to quantify the effect of the most important water retention variables. Each dataset is followed by a data analysis commentary to support technical decision-making.
4.1 Mixer Water Addition: Dose–Response and Retention Efficiency
The effect of water addition at the mixer stage on finished product MC has been measured in multiple published studies. The following table consolidates the dose–response data:
| Water Added at Mixer | Finished Product MC | MC Increase vs. Control | Retention Rate | Source |
| 0% (control) | 11.02% | Baseline | Baseline | RICHI / Feed & Additive Mag. |
| 0.5% | 11.33% | +0.31% | ~62% | RICHI / Feed & Additive Mag. |
| 1.5% | 12.01% | +0.99% | ~66% | RICHI / Feed & Additive Mag. |
| 2.5% | 12.32% | +1.30% | ~52% | RICHI / Feed & Additive Mag. |
| 2.5% (barley diet, expander) | MC increase +PDI 93→95% | PDI +2% | — | Moritz et al., ResearchGate 2002 |
| 3.0% (maize diet) | PDI 84→89% (constant motor) | PDI +5% | — | Moritz et al., ResearchGate 2002 |
| 0, 25, 50 g/kg (0, 2.5, 5%) | PDI 75.6%, 76.9%, 79.6% | PDI +4% at 5% | — | Moritz et al. Engormix review |
Table 3. Dose–response data: mixer water addition vs. finished MC and PDI. Sources: RICHI Machinery; ResearchGate (Moritz et al., 2002); Engormix review (2017).
Data Analysis — Diminishing Returns: The data reveal a clear pattern of diminishing retention efficiency as mixer water addition increases: at 0.5% addition, approximately 62% is retained; at 2.5% addition, only 52% is retained. This means that each additional litre of water added beyond 1.5% of mash weight provides progressively less benefit per litre invested. The practical implication is that mixer water addition should target the deficit between actual mash MC and the minimum conditioning threshold (12.5%), not be used as the primary tool to achieve high finished product MC. Simultaneously, the Moritz data show that water addition does improve PDI: adding 30 g/kg (3%) to a maize diet improved PDI from 84% to 89% at constant motor load—a 5-percentage-point gain that has direct commercial value in reducing fines and reprocessing cost.
4.2 Conditioning Temperature: Effect on PDI
Steam conditioning temperature is one of the most studied variables in pellet quality research. The relationship between temperature and PDI has been quantified in controlled trials:
| Conditioning Temperature | PDI Achieved | Pellet Hardness (kg crush force) | Hot Pellet Temperature | Source |
| 54°C (low) | 87% | 13.5 kg | 68°C | Wecker et al., ResearchGate 2020 |
| 63°C (medium) | ~90% | ~14.7 kg | 72°C | Wecker et al., ResearchGate 2020 |
| 71°C (high) | 92% | 15.9 kg | 74°C | Wecker et al., ResearchGate 2020 |
| 82.2°C (optimal) | 88% (max with 14% MC + 80% steam quality) | — | ~85°C | Moritz et al. (conditioner study) |
| High moisture (927 g/kg DM) + conditioning | 82.2% PDI | — | — | Engormix review citing Moritz |
| Low moisture (853 g/kg DM) + conditioning | 56.5% PDI | — | — | Engormix review citing Moritz |
Table 4. Effect of conditioning temperature on PDI and pellet hardness. Sources: Wecker et al. (ResearchGate, 2020); Moritz et al.; Engormix (2017).
Data Analysis — Temperature as a Linear PDI Driver: The Wecker et al. data show a clear linear relationship: PDI increases from 87% at 54°C to 92% at 71°C—a 5-percentage-point gain for a 17°C increase in conditioning temperature. Pellet hardness follows the same pattern (13.5 to 15.9 kg, a 18% increase). Critically, the Moritz data reveal that moisture and temperature interact: feeds conditioned at 82.2°C with 14% mash MC achieved 88% PDI, while the same temperature with low moisture (853 g/kg DM ≈ 14.7% MC) achieved only 56.5% PDI. This demonstrates that temperature alone is insufficient—moisture must be at the optimal level simultaneously to realise the full PDI benefit. The practical message: do not attempt to compensate for low mash moisture by increasing conditioning temperature; address the moisture deficit first.
4.3 The Effect of Moisture on PDI: High vs. Low Moisture Mash
The most striking dataset in the moisture–PDI literature is the comparison of high versus low initial moisture mash conditioned at the same temperature:
| Mash Moisture Level | PDI After Conditioning | PDI Difference | Interpretation |
| High moisture (927 g/kg DM ≈ ~12% wet-weight) | 82.2% | +25.7 pp | Adequate moisture → effective starch gelatinisation → strong bonding |
| Low moisture (853 g/kg DM ≈ ~7.5% wet-weight) | 56.5% | Baseline | Insufficient moisture → incomplete gelatinisation → weak pellets |
| 0 g/kg water addition (maize diet) | 84% | +0% | Baseline without mixer addition |
| 30 g/kg water addition (maize diet) | 89% | +5 pp | 3% addition improves PDI by 5 percentage points |
| 50 g/kg water addition (barley diet) | PDI 93→95% | +2 pp (expander) | Higher addition with expander; diminishing return vs. 3% |
| 2% mixer addition, wheat inclusion up 20% | PDI decreased (P<0.05) | Negative | Excess mixer moisture + high wheat = over-wet mash → die plugging |
Table 5. Effect of mash moisture level on PDI. Sources: Moritz et al.; Wecker et al. (ResearchGate); Engormix review (2017).
Data Analysis — The 25-Point PDI Gap: The 25.7-percentage-point PDI gap between high-moisture and low-moisture mash conditioned at the same temperature is the most economically significant finding in the water retention literature. It demonstrates unambiguously that moisture is not a secondary factor in pellet quality—it is a primary determinant. A mill operating with consistently low mash moisture (below 12.5%) is leaving 20+ PDI points on the table, even with correct conditioning temperature. However, the Wecker data also show a ceiling effect: at 2% mixer water addition with high-wheat diets, PDI decreased—indicating that over-wetting can cause die plugging and pellet quality deterioration. The optimal mash moisture window is 14.0–15.5% post-conditioning; this is not a target to exceed.
4.4 Conditioning Retention Time: The Undervalued Variable
Retention time determines how long the mash is exposed to steam before entering the die. Longer retention allows more complete moisture penetration into particle interiors—converting surface moisture to bound moisture. Published data:
| Retention Time | PDI Effect | Study/Source | Notes |
| Extended vs. standard | Average +4.5% PDI | Briggs et al. (1999) | Meta-level finding across multiple feeds |
| > 4 minutes | More uniform moisture penetration | Plattner (2002) | Heat transfer throughout particle cross-section |
| 0 → 80 seconds (range) | PDI and hardness increase (linear) | Massuquetto et al. (2018) | Both metrics respond positively |
| Standard single conditioner | 15–30 seconds typical | Industry standard | Minimum for poultry/livestock compound feeds |
| Double conditioner / expander | 60–120+ seconds | Equipment specification | Required for high-protein, hydrophobic ingredients |
| Diet composition contributes ≤ 25% of PDI variability | Remaining ≥ 75% = process variables | ResearchGate (2025) | Confirms process > formulation for pellet quality |
Table 6. Effect of conditioner retention time on PDI. Sources: Briggs et al. (1999); Plattner (2002); Massuquetto et al. (2018); ResearchGate (2025).
Data Analysis — 4.5% PDI Gain at Zero Additive Cost: The Briggs et al. finding of an average 4.5% PDI improvement from extended retention time is particularly significant because it requires no additive cost—only process time. For mills currently operating standard single-pass conditioners at 15–30 seconds, upgrading to a double conditioner or expander-conditioner configuration to achieve 60–120 seconds of retention can deliver PDI gains equivalent to those seen from moderate moisture addition, without ongoing consumable cost. At a mill producing 150,000 tonnes per year, a 4.5% PDI improvement translates to approximately 6,750 fewer tonnes of feed at risk of fines generation per year—assuming 10% of production was previously in the marginal PDI zone.
4.5 Fat Content: The Negative Modifier of Water Retention
Diet fat content is the most consistently reported negative modifier of both water retention and PDI across the published literature:
| Fat Level | PDI Impact | Mechanism | Source |
| Increasing fat (general) | Negative, well established | Fat coats starch granules; blocks moisture transfer from steam; prevents gelatinisation | PMC (Cavalcanti & Behnke model) |
| Mixer fat coefficient | −3.43 to −1.02 (PDI units) | Each 1% fat added in mixer reduces PDI by 1.02–3.43 points | PMC PDI prediction model (2025) |
| Soybean oil 1.5% in mixer | Better tolerated vs. Ca fat powder at same level | Liquid vs. solid fat behaviour difference | Engormix review |
| Mixer fat > 3% | Significant negative effect on PPQ | Liquid fat excess prevents gelatinisation | Industry consensus, All About Feed |
| ADF content | Significant negative PDI association (P-value) | Fibre interferes with starch-binding matrix | PMC PDI regression model (2025) |
| Heat processing (conditioning-pelleting) | Accounts for 44% of PDI variability | Single largest process factor | Muramatsu study, Engormix review |
Table 7. Effect of fat content and diet composition on PDI. Sources: PMC (PDI prediction model, 2025); Engormix review (Muramatsu study, 2017).
Data Analysis — The 44% Process vs. 25% Formulation Rule: Two key quantitative benchmarks emerge from the composition data: (1) heat processing (conditioning and pelleting) accounts for 44% of observed PDI variability in a multi-factor study—making it the single largest controllable variable in pellet quality; (2) diet composition effects on pellet quality do not exceed 25% of PDI variability, as confirmed by multiple researchers. This hierarchy has a direct strategic implication: process optimisation (moisture, temperature, retention time, steam quality) has approximately 1.75× more impact on PDI than reformulation. Fat’s negative coefficient of −1.02 to −3.43 PDI units per percent added means that a formulation with 5% mixer-added fat could be losing up to 17 PDI points to fat interference alone—a loss that moisture management and surfactant addition can partially offset.
4.6 Moisture Retention Additive Performance: Commercial Trial Data
Advanced moisture retention products combining glycerol esters of propionic acid with surfactants have been evaluated in commercial settings. The most comprehensive dataset comes from an 8-mill meta-analysis:
| Parameter | Control Group | With Retention Additive | Improvement | Study/Source |
| Moisture retention rate | Baseline | +98.2% | +98.2% vs. control | 8-mill meta-analysis, SmartMoisture |
| PDI | Baseline | +13.4 percentage points | +13.4% | 8-mill meta-analysis |
| Finished feed aw | Above 0.65 in some mills | 0.64 | Below mould threshold (0.65) | 8-mill meta-analysis |
| Finished feed MC | ~11.0% (over-dried) | 12.4% | +1.4 percentage points | 8-mill meta-analysis |
| Aqua-feed aw | Control level | < 0.55 despite +4% MC | −0.10+ aw vs. control | SmartMoisture aqua-feed trial |
| Enterobacteriaceae | Above 2,400 CFU/g in challenged feed | < 2,400 CFU/g | Safety threshold maintained | Commercial feed safety trial |
| PDI at low initial PDI (<75%) | < 75% | Significant improvement | Largest gain in low-PDI feeds | All About Feed (2025) graph data |
| PDI at high initial PDI (>90%) | Already > 90% | Largely unaffected | Diminishing returns at high PDI | All About Feed (2025) graph data |
Table 8. Moisture retention additive performance data from commercial trials. Sources: SmartMoisture 8-mill meta-analysis; All About Feed (Dec 2025).
Data Analysis — Non-Linear PDI Response and the ‘Low PDI’ Priority: The All About Feed data (2025) introduces a critical nuance in moisture retention additive application: the PDI improvement from moisture addition is largest when initial PDI is low (< 75%), and diminishes as initial PDI approaches or exceeds 90%. This non-linear response has important targeting implications. Mills with PDI consistently above 90% should not expect significant PDI gains from moisture retention additives—their PDI is already limited by other factors (die condition, formulation). But mills where PDI is hovering in the 75–88% range stand to gain the most: the gap between 75% and 88% PDI represents a large difference in fines generation, customer quality, and reprocessing cost, and moisture management can close much of this gap. The 98.2% improvement in moisture retention rate simultaneously addresses yield and safety (aw 0.64 < 0.65 mould threshold), making this additive category uniquely able to deliver multiple commercial objectives in a single intervention.
4.7 Pellet Binder Performance Data
| Binder Type | Inclusion Rate | PDI Improvement | Source |
| Sodium bentonite | 2.4% of diet | Durability +6%; fines reduced in poultry feed | Pfost & Young; Attar et al. (2017) |
| Processed sodium bentonite | 1.5% (15 g/kg) + 2-min conditioning | PDI and hardness increased; energy consumption decreased | Attar et al. (2019) — ScienceDirect |
| Calcium lignosulfonate | 0.5–1.0% | Significant PDI improvement esp. in high-fat diets | Borregaard; multiple species trials |
| Particle size reduction | 1,000 μm → 400 μm | PDI 78.8% → 86.4% (+7.6 pp) | Wondra et al. — Engormix review |
| Particle size reduction | < 300 μm | Improved gelatinisation; high-quality durable pellet | All About Feed (Jan 2026) review |
| Molasses | 2–5% | Moderate PDI improvement + palatability benefit | Industry consensus |
Table 9. Pellet binder and particle size effect on PDI. Sources: Pfost & Young; Attar et al. (2017, 2019); Wondra et al.; All About Feed.
Data Analysis — Particle Size as the Highest-ROI No-Additive Intervention: The Wondra particle size data (PDI 78.8% → 86.4% from 1,000 to 400 μm) represents one of the largest PDI gains achievable without any additive cost—only adjustment of hammer mill screen aperture. A 7.6-percentage-point PDI gain from particle size optimisation exceeds the average PDI gain from binder addition and is comparable to the gain from extended conditioning time. The combination of fine grinding + optimal conditioning moisture + extended retention time represents a ‘zero consumable’ bundle of improvements that should be the first intervention for any mill with PDI below 90%.
4.8 Cooler Control: Quantifying Seasonal Moisture Loss
The counterflow cooler is the stage where the most controllable moisture loss occurs. Published data on cooler moisture dynamics:
| Cooler Scenario | Moisture Removed | Finished MC | Impact |
| Standard operation (temperate climate) | 3–5% MC | 12–13% | Target range; acceptable |
| Excess cooling (low ambient RH / high airflow) | 4–6% MC | < 11.5% | Over-dried; brittle pellets; revenue loss |
| Under-cooling (high ambient RH / tropical) | 2–3% MC | > 13% | Above safety limit; mould risk in packaging |
| Rule of thumb | −1% MC per −11°C temperature reduction | Inverse relationship | Calibration reference for cooler control |
| Automated cooler control (Adiveter 4.0 Cooler Plus) | Reduces unintended loss by 0.15–0.40 pp | Seasonal variation managed | Published system performance data |
| Poultry feed (inlet target) | From ~85°C inlet | ≤ 13% target | Standard specification |
| Cattle feed with molasses (inlet target) | From ~65°C inlet | ≤ 13% target | Lower temp due to molasses content |
Table 10. Cooler moisture dynamics and control outcomes. Sources: Feed & Additive Magazine; Benison Media; Adiveter system data.
Data Analysis — The 0.15–0.40% Cooler Recovery: The automated cooler control system data (0.15–0.40 percentage point moisture recovery) may appear modest, but at mill scale it is commercially significant. For a 150,000 t/year mill, 0.25% additional retained MC represents 375 additional tonnes of finished product per year—at USD 350/t, that is USD 131,250 in annual revenue recovered from a single control system upgrade. Furthermore, the cooler is the most weather-sensitive stage: without dynamic control, the same cooler settings produce 11.5% MC in summer and 12.5% MC in winter, creating batch-to-batch quality inconsistency that the bagging weight system cannot compensate for.
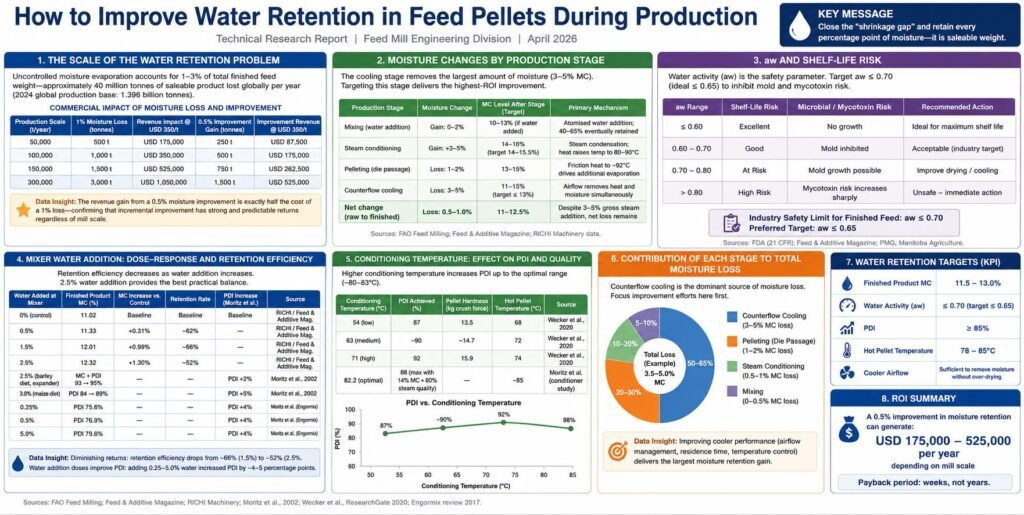
5. Strategy Overview by Intervention Domain
Based on the quantitative data in Chapter 4, the following five intervention domains are ranked by evidence-supported impact. Each is described with its mechanism, target parameters, and data-supported expected outcome.
5.1 Pre-Pelleting Moisture Preparation
- NIR moisture sensors at raw material intake: documents lot-by-lot MC baseline; enables recipe-level moisture compensation before production begins
- Mixer water addition: up to 2% of mash weight; use hot water (not ambient) to reduce mould risk and improve distribution; add after dry mixing and before oil
- Target minimum mash MC at conditioner inlet: 12.5%; optimal post-conditioning target: 14.0–15.5%
- Particle size optimisation: target < 300 μm (poultry) or 400–700 μm (swine) to maximise steam absorption surface area; evidence shows 7.6% PDI gain from 1,000 → 400 μm
5.2 Steam Conditioning Optimisation
- Steam quality: saturated dry steam only; install cyclone steam separators and pressure regulation valves upstream of conditioner header
- Temperature target: 78–83°C for most livestock/poultry feeds; do not compensate for low moisture by increasing temperature—both must be optimal simultaneously
- Retention time: target ≥ 30 seconds; consider double conditioner or expander-conditioner for ≥ 60 seconds to capture the full 4.5% PDI improvement from extended conditioning
- Post-conditioning MC verification: in-line NIR or microwave sensor at conditioner discharge; adjust steam flow in closed-loop to maintain 14.0–15.5% MC target
5.3 Moisture Retention Additive Technologies
- Glycerol esters of propionic acid + surfactants: the highest-impact single additive intervention; 8-mill data show +98.2% retention, +13.4% PDI, aw 0.64 at 12.4% MC
- Application via precision MDS (Moisture Dosing System): PLC-controlled, electromagnetic flow meter, flat-spray nozzles; added after dry mixing, before oil addition
- Surfactants alone: improve moisture distribution and die lubrication; valuable in hydrophobic high-protein diets
- Target application: prioritise mills with PDI consistently below 88%—this is where moisture retention additive effect is largest
5.4 Pellet Binders
- Calcium lignosulfonate (0.5–1.0%): broad-spectrum PDI improvement; most effective in high-fat diets where natural starch bonding is reduced
- Sodium bentonite (1.0–2.5%): +6% PDI at 2.4% inclusion; simultaneously absorbs moisture during conditioning and contributes to pellet structural integrity
- Both binders provide incremental PDI improvement beyond what moisture management alone can achieve; they are additive strategies, not substitutes for process optimisation
5.5 Cooler Management
- Counterflow cooler design: cracking rate reduction > 90% vs. shock cooling; uniform pellet temperature and MC removal
- Variable-speed fan drives (VFDs): allow airflow modulation for seasonal RH variation; prevent over-drying in low-humidity conditions
- Automated cooler control systems: 0.15–0.40 pp moisture recovery; real-time adjustment of airflow and retention time based on ambient humidity and pellet temperature
- Exit temperature target: ≤ ambient + 5°C; verify with continuous thermometer at cooler discharge
6. Integrated Evidence-Ranked Implementation Framework
| Rank | Intervention | Evidence-Supported PDI/MC Gain | Cost Level | Payback Period |
| 1 | Particle size optimisation (grind to < 400 μm) | PDI +7.6 pp (Wondra et al.) | Low (screen change only) | Immediate |
| 2 | Steam quality audit + separator installation | PDI varies; moisture retention major gain | Low–Medium | Weeks |
| 3 | Mash MC management: add water to reach 14–15.5% post-conditioning | PDI +5 pp at 3% addition (Moritz); +25 pp vs. low-MC mash | Low (water cost) | Immediate |
| 4 | Glycerol ester + surfactant moisture retention additive via MDS | MC retention +98.2%; PDI +13.4%; aw 0.64 (8-mill meta) | Medium (additive + MDS) | 2–4 weeks |
| 5 | Extended conditioner retention time (double conditioner or expander) | PDI +4.5% average (Briggs et al.) | High (capital) | 6–18 months |
| 6 | Automated cooler control (VFD + humidity sensor + control system) | MC recovery +0.15–0.40 pp seasonally | Medium (capital) | 6–12 months |
| 7 | Pellet binder addition (Ca-lignosulfonate 0.5–1%; bentonite 1–2.5%) | PDI +6% (bentonite 2.4%); significant for high-fat diets | Low–Medium (additive) | Immediate |
| 8 | NIR in-line sensors (post-mixer + post-cooler) with closed-loop control | Variance reduction; enables interventions 3–6 | Medium | 3–6 months |
Table 11. Evidence-ranked implementation framework: interventions, quantified gains, cost, and payback period.
Framework Analysis — The No-Cost Bundle vs. The Full Programme: Ranks 1–3 in the framework require minimal or no ongoing consumable cost: particle size optimisation (screen change), steam quality (separator installation), and mash moisture management (water cost only). These three interventions alone can deliver PDI improvements of 5–25+ percentage points depending on baseline conditions. Ranks 4–8 add consumable and capital costs, but deliver sustained, year-round benefits regardless of raw material variability. The highest-ROI sequence for a mill with a limited budget is: first implement Ranks 1–3 (zero or near-zero ongoing cost), measure the PDI baseline after 30 days, then selectively add Rank 4 (moisture retention additive) if PDI remains below 90%, and Rank 6 (cooler control) if seasonal moisture loss is identified as a significant issue.
7. Key Performance Indicators for Water Retention
| KPI | Target | Measurement Point | Frequency | Action if Out of Range |
| Post-conditioning MC | 14.0–15.5% | Conditioner discharge | Continuous (NIR/microwave) | Adjust steam flow rate; check mash MC at inlet |
| Conditioning temperature | 78–83°C | Conditioner outlet thermometer | Continuous | Check steam quality; steam separator function |
| Finished pellet MC | 12.0–13.0% | Post-cooler (NIR in-line) | Continuous | Adjust cooler airflow / retention time |
| Finished pellet aw | ≤ 0.70 (target ≤ 0.65) | Post-cooler (aw meter) | Every batch | Investigate steam quality; verify cooler exit temp |
| PDI at press | ≥ 90% (target ≥ 92%) | Post-cooler tumbling test | Every batch / hourly | Review moisture, temperature, retention time, fat level |
| Moisture loss: raw → finished | ≤ 0.5% difference | Intake NIR vs. post-cooler NIR | Daily average | Identify loss stage; prioritise cooler or grinding audit |
| Cooler exit temperature | ≤ Ambient + 5°C | Cooler discharge thermometer | Continuous | Increase airflow or retention time |
| Fines at bagging | ≤ 3% by weight | Pre-bagger screen output | Every batch | Review PDI; check handling system drop heights |
Table 12. Key performance indicators (KPIs) for water retention management, with targets and corrective action triggers.
8. Conclusions
This report has quantified the relationships between the key variables governing water retention in feed pellets, establishing an evidence base for prioritised intervention. The principal conclusions are:
- The moisture-PDI relationship is powerful and non-linear: the gap between high-moisture (927 g/kg DM) and low-moisture (853 g/kg DM) mash conditioned at the same temperature is 25.7 PDI points (82.2% vs. 56.5%). No process variable except heat treatment itself exerts a larger effect on pellet quality.
- Mixer water addition has diminishing returns: retention efficiency falls from ~65% at 1.5% addition to ~52% at 2.5% addition. Mixer water should be used to reach the minimum conditioning threshold (12.5% inlet MC), not as a primary moisture retention strategy.
- Conditioning temperature improves PDI linearly: from 87% at 54°C to 92% at 71°C—but only when mash moisture is simultaneously at the optimal level. Temperature cannot compensate for low moisture.
- Extended conditioning time delivers 4.5% PDI gain at zero consumable cost: the most underutilised lever in most commercial feed mills, achievable through double conditioner or expander-conditioner equipment investment.
- Diet composition (≤ 25% of PDI variability) is less important than process (44% from heat treatment alone): process optimisation has approximately 1.75× more leverage than reformulation for improving pellet quality and water retention.
- Glycerol ester + surfactant moisture retention products deliver the largest single additive intervention: +98.2% moisture retention and +13.4% PDI from 8-mill commercial meta-analysis, with aw safely maintained at 0.64 at 12.4% MC. The PDI benefit is greatest for mills currently below 88% PDI.
- Cooler control prevents 0.15–0.40 percentage points of seasonal moisture loss: at 150,000 t/year, this represents USD 78,750–210,000 in annual revenue recovered from a single control system upgrade.
- The no-cost bundle—particle size optimisation + steam quality audit + mash moisture management—can deliver 5–15+ PDI points of improvement before any additive or capital expenditure, and should be the first phase of any moisture retention improvement programme.
References and Data Sources
- FAO (Food and Agriculture Organization). Chapter 18: Feed Milling Processes. fao.org/4/x5738e/x5738e0j.htm
- Moritz, J.S. et al. (2002). Feed moisture, retention time, and steam as quality and energy utilisation determinants in the pelleting process. ResearchGate. DOI available via ResearchGate.
- Moritz, J.S. et al. (2003). Feed manufacture and feeding of rations with graded levels of added moisture forming mash and pellet diets. Journal of Applied Poultry Research, 12(3):371–381.
- Wecker, H.K., Paulk, C.B. et al. (2020). PSI-11 Moisture Content Throughout the Pelleting Process and Subsequent Effects on Pellet Quality. ResearchGate.
- Briggs, J.L. et al. (1999). Effects of ingredients and processing parameters on pellet quality. Poultry Science 78:1464–1471.
- Plattner, B. (2002). Moisture penetration and heat transfer with extended conditioning. Feed industry reference.
- Massuquetto, A. et al. (2018). Effect of conditioning time on PDI and pellet hardness. Poultry Science.
- Muramatsu, K. (study referenced in Engormix, 2017). Heat processing accounts for 44% of PDI variability in corn-soybean diet model.
- Wondra, K.J. et al. (referenced in Engormix review, 2017). PDI 78.8% → 86.4% with particle size reduction from 1,000 to 400 μm.
- Cavalcanti, W.B. & Behnke, K.C. (2005). Effect of composition on pellet quality: mixer fat coefficient −3.43 to −1.02. Response surface methodology.
- PMC / NCBI (2025). Prediction of Pellet Durability Index in a commercial feed mill using multiple linear regression with variable selection. PMC11914881.
- Attar, A. et al. (2017, 2019). Effects of sodium bentonite on pellet quality and energy consumption. ScienceDirect.
- Pfost, H.B. & Young, L.R. Bentonite as pellet binder and durability effect. Kansas State University.
- Engormix (2017). Factors That Affect Pellet Quality: A Review. en.engormix.com
- All About Feed (Dec 2025). Improving pellet quality by addressing low moisture content through moisture addition — SmartMoisture graph data. allaboutfeed.net
- All About Feed (Jan 2026). Reviewing the pelleting process to ensure quality. allaboutfeed.net
- Feed & Additive Magazine (2022). Moisture changes and control measures during the pellet processing — ADIVETER 4.0 system data. feedandadditive.com
- Feed & Additive Magazine (2026). Maximizing mill profitability and operational resilience — moisture loss 1–2% industry data. feedandadditive.com
- RICHI Machinery. Feed water retention and water control in the animal feed factory production process. richimachinery.com
- Borregaard (2024). LignoBond calcium lignosulfonate pellet binder technical data. borregaard.com
- Benison Media (2021). Cooling—A critical process for pellet durability index and feed hygiene. benisonmedia.com
- Alltech (2025). 2025 Alltech Agri-Food Outlook — Global compound feed production 1.396 billion metric tonnes.