
Downtime in animal feed factories directly increases production cost per ton, reduces delivery reliability, causes formula change delays, increases labor overtime, reduces pellet quality stability, and may lead to customer complaints. In many feed mills, downtime is concentrated around several critical systems: grinding, batching, mixing, steam conditioning, pellet mill, cooler, conveying, bagging, utilities, and electrical control.
Among these, the pellet mill is often the main production bottleneck. A poultry feed mill optimization study identified the pelleting machine as the main production limitation and linked production loss to pellet mill stoppage; improvement actions included changes related to die holes and operating conditions.
Downtime reduction should not rely only on emergency repair. It should be managed through a reliability system based on OEE, MTBF, MTTR, preventive maintenance, predictive monitoring, spare parts planning, operator inspection, and root cause analysis. OEE is commonly calculated from availability, performance, and quality; MTBF and MTTR help explain whether lost availability is caused by frequent failures or long repair time.
For an animal feed factory, the engineering objective is clear:
Reduce unplanned downtime, shorten repair time, stabilize production flow, and increase effective tons produced per hour without sacrificing feed quality or equipment life.
1- What Is Downtime in an Animal Feed Factory?
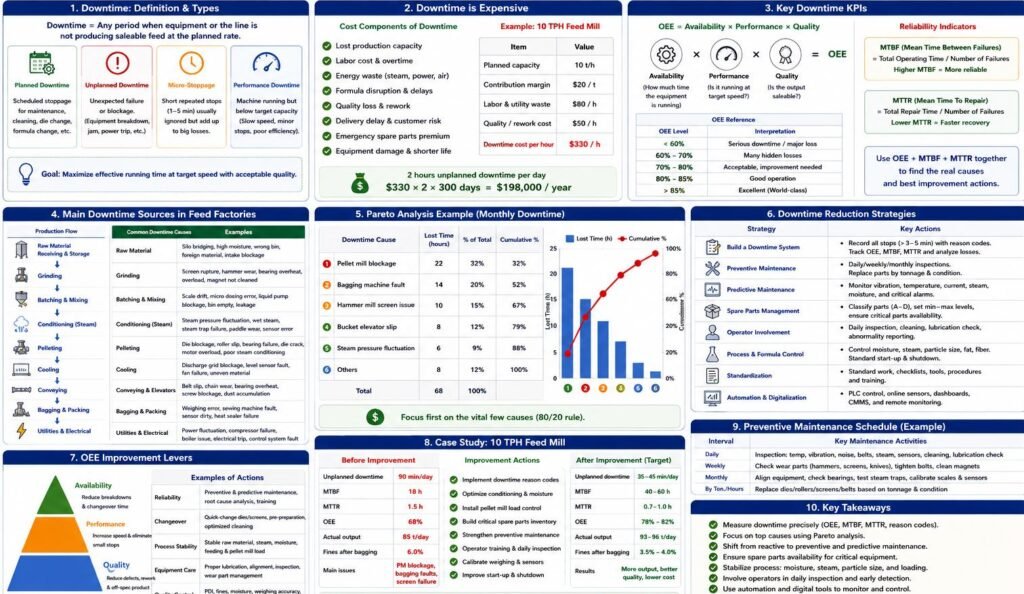
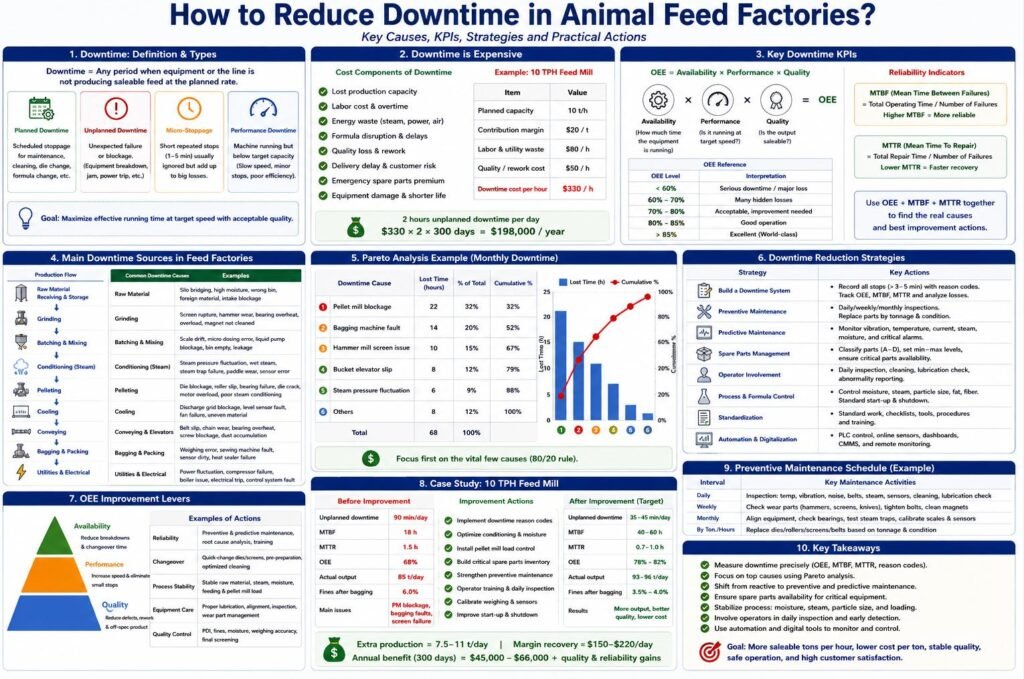
Downtime means any period when equipment or the production line is not producing saleable feed at the planned rate.
It can be divided into four categories:
| Downtime Type | Description | Example in Feed Factory | Control Priority |
|---|---|---|---|
| Planned downtime | Scheduled stoppage for maintenance, cleaning, die change, or formula change | Weekly pellet mill inspection | Optimize duration |
| Unplanned downtime | Unexpected failure or blockage | Pellet mill jam, bucket elevator belt slip | Reduce frequency |
| Micro-stoppage | Short repeated stops, usually ignored in manual records | Bagging sensor fault, conveyor blockage | Record and eliminate |
| Performance downtime | Machine running but below target capacity | Pellet mill running at 70% load | Improve stability |
Planned downtime is not always bad. It is often necessary for preventive maintenance and sanitation. The real problem is uncontrolled, repeated, and unplanned stoppage. Planned downtime allows labor, tools, spare parts, and production schedule to be prepared, while unplanned downtime creates emergency repair and production disruption.
2- Why Downtime Is Expensive
Downtime cost is not only the value of lost production. It includes many hidden cost items.
2.1- Main cost components
| Cost Item | Downtime Impact |
|---|---|
| Lost production capacity | Fewer tons produced per shift |
| Labor cost | Operators and maintenance staff wait or work overtime |
| Energy waste | Steam system, compressors, fans, and conveyors may continue running |
| Formula disruption | Delayed batches and sequencing problems |
| Pellet quality loss | Restart instability, poor conditioning, fines increase |
| Rework | Off-spec pellets may need reprocessing |
| Delivery delay | Customer service risk |
| Spare parts premium | Emergency parts purchase and express freight |
| Equipment damage | Small failure may become major failure if not detected early |
2.2- Downtime cost calculation
A practical formula:
Downtime cost per hour = lost production tons per hour × contribution margin per ton + labor cost + energy waste + rework/quality cost
Example for a 10 TPH feed mill:
| Item | Value |
|---|---|
| Planned capacity | 10 t/h |
| Contribution margin | $20/t |
| Labor and utility waste | $80/h |
| Quality/rework allowance | $50/h |
Downtime cost:
10 t/h × $20/t + $80/h + $50/h = $330/h
If the plant has 2 hours of unplanned downtime per day:
$330/h × 2 h/day × 300 days = $198,000/year
For larger plants, the loss can be much higher.
3- Key Downtime KPIs for Feed Factories
Downtime cannot be reduced effectively unless it is measured correctly.
3.1- OEE
OEE, or Overall Equipment Effectiveness, measures how effectively a production asset is used. It combines availability, performance, and quality.
OEE = Availability × Performance × Quality
| OEE Component | Meaning in Feed Mill | Example Loss |
|---|---|---|
| Availability | Is the line running when scheduled? | Pellet mill breakdown |
| Performance | Is the line running at target speed? | Hammer mill capacity drop |
| Quality | Is the output saleable? | Excess fines or wrong formula |
Practical OEE reference for feed mills:
| OEE Level | Interpretation |
|---|---|
| < 60% | Serious downtime or performance loss |
| 60%–70% | Many hidden stoppages |
| 70%–80% | Acceptable but improvement needed |
| 80%–85% | Good feed mill operation |
| > 85% | Excellent, requires strong maintenance and automation |
3.2- MTBF
MTBF means Mean Time Between Failures.
MTBF = total operating time / number of failures
Example:
If a pellet mill operates 600 hours in one month and has 6 unplanned failures:
MTBF = 600 / 6 = 100 hours
A rising MTBF means the equipment is becoming more reliable.
3.3- MTTR
MTTR means Mean Time To Repair.
MTTR = total repair time / number of failures
Example:
If 6 failures cause 18 hours of repair time:
MTTR = 18 / 6 = 3 hours
A lower MTTR means the plant repairs equipment faster.
3.4- Why OEE, MTBF, and MTTR should be used together
OEE shows where production time is lost. MTBF and MTTR explain why the time is lost. A low MTBF indicates frequent failures, while a high MTTR indicates slow repair. Combining these indicators gives a more complete reliability picture.
| Problem Pattern | KPI Signal | Main Action |
|---|---|---|
| Frequent small stops | Low MTBF, low MTTR | Remove root causes, improve inspection |
| Rare but long failures | High MTBF, high MTTR | Improve spare parts, repair skills, tools |
| Slow production | Normal MTBF, low performance | Optimize process and machine loading |
| Quality-related downtime | Low quality rate | Improve formula, conditioning, screening |
4- Main Downtime Sources in Animal Feed Factories
4.1- Raw material receiving and storage
Common downtime causes:
*- Truck unloading delay
*- Silo blockage
*- Poor flowability
*- High-moisture raw materials
*- Foreign material entering conveyors
*- Incorrect ingredient stored in wrong bin
*- Dust collector blockage
Recommended controls:
| Problem | Preventive Action |
|---|---|
| Silo bridging | Install vibration, air cannon, or proper cone angle |
| Foreign material | Use magnets, scalpers, and intake screens |
| Wrong material bin | Barcode or RFID receiving verification |
| High moisture | Test every batch and control supplier quality |
| Intake dust blockage | Maintain filters and aspiration system |
4.2- Grinding system downtime
Hammer mills and roller mills are high-load equipment. Grinding downtime often comes from screen damage, hammer wear, bearing overheating, blockage, and inconsistent feeding.
| Failure Mode | Cause | Downtime Prevention |
|---|---|---|
| Hammer mill blockage | Feed rate too high, wet material | Automatic feeder control |
| Screen rupture | Foreign object, fatigue | Magnet and screen inspection |
| Bearing overheating | Lubrication failure, dust ingress | Temperature monitoring |
| Capacity drop | Worn hammers or screen | Replace based on kWh/t and particle size |
| Excess vibration | Rotor imbalance | Vibration monitoring and balancing |
Recommended grinding KPIs:
| KPI | Target |
|---|---|
| Hammer mill load | 80%–95% of rated load |
| Bearing temperature | Trend monitored; alarm when abnormal |
| Vibration | Baseline + alarm threshold |
| Particle size deviation | Within formula target |
| Screen inspection | Daily or by production tonnage |
| Magnet cleaning | At least once per shift |
4.3- Batching and mixing downtime
Batching and mixing downtime is often caused by dosing system errors rather than mechanical failure.
Common causes:
*- Scale calibration drift
*- Micro-ingredient dosing fault
*- Liquid pump blockage
*- Bin empty alarm
*- Formula change error
*- Mixer discharge gate leakage
*- Residue accumulation
Recommended controls:
| Control Point | Recommended Practice |
|---|---|
| Scale calibration | Daily quick check, scheduled full calibration |
| Micro-ingredient dosing | Barcode verification and automatic weighing |
| Mixer discharge gate | Seal inspection weekly |
| Liquid addition | Filter and pump inspection |
| Formula management | PLC permission control and recipe locking |
| Mixer residue | Cleaning plan based on formula risk |
4.4- Pellet mill downtime
The pellet mill is one of the most critical assets in animal feed factories. Pellet mill downtime can stop the whole downstream production line.
A poultry feed mill study found that the pelleting machine was the main bottleneck in the production line, and reducing pellet mill stoppage improved production performance.
Common pellet mill downtime causes:
| Failure Mode | Technical Cause | Preventive Measure |
|---|---|---|
| Die blockage | Formula too wet, high fiber, poor conditioning | Control moisture and feed rate |
| Roller slip | Incorrect roller gap, worn roller shell | Adjust roller-die gap |
| Die crack | Fatigue, wrong material, overload | Inspect die and avoid shock loading |
| Bearing failure | Poor lubrication, contamination | Grease management and temperature monitoring |
| Main motor overload | Excess feed, high compression ratio | Automatic load control |
| Poor pellet discharge | Knife setting, die wear | Inspect knives and die holes |
| Coupling or belt failure | Misalignment, overload | Alignment and tension inspection |
Research on ring die failure shows that die failure analysis may include macroscopic and microscopic fracture morphology, chemical composition, mechanical properties, and operating stress conditions, confirming that die failure is a technical reliability issue rather than a simple wear problem.
Recommended pellet mill maintenance parameters:
| Item | Recommended Control |
|---|---|
| Roller-die gap | Typically 0.1–0.3 mm depending on machine and material |
| Die inspection | Daily visual check; full inspection by tonnage |
| Roller shell wear | Track by production tonnage and pellet quality |
| Main bearing temperature | Continuous or shift-based monitoring |
| Main motor load | Stable at 80%–95% during normal production |
| Conditioner steam pressure | Stable according to formula |
| Die change time | Standardize tools and reduce to planned target |
4.5- Steam and conditioning system downtime
Steam system problems cause both downtime and pellet quality problems.
Common problems:
*- Steam pressure fluctuation
*- Wet steam
*- Condensate carryover
*- Steam trap failure
*- Conditioner paddle wear
*- Temperature sensor error
*- Insufficient retention time
Recommended controls:
| Control Point | Target |
|---|---|
| Steam quality | Dry saturated steam preferred |
| Steam pressure | Stable, formula-specific |
| Condensate removal | Steam traps inspected regularly |
| Conditioning temperature | Usually 75–90°C for many feed pellets |
| Retention time | 30–90 s for many livestock feeds |
| Temperature sensor | Calibrated regularly |
| Conditioner cleaning | Scheduled to prevent buildup |
4.6- Cooler downtime
Cooler downtime can be caused by discharge grid blockage, level sensor fault, fan failure, uneven material distribution, or dust collector problems.
| Failure Mode | Result | Control Method |
|---|---|---|
| Discharge gate stuck | Material accumulation | Mechanical inspection and cleaning |
| Level sensor failure | Overfill or underfill | Sensor testing and backup logic |
| Fan failure | Hot pellets, mold risk | Bearing and belt inspection |
| Dust collector blockage | Airflow reduction | Filter cleaning schedule |
| Uneven discharge | Moisture variation | Check grid and drive mechanism |
Recommended cooler targets:
| Parameter | Target |
|---|---|
| Outlet temperature | Ambient + 3–5°C |
| Moisture variation | ≤ ±0.5% |
| Retention time | 5–8 min for many standard pellets |
| Bed depth | 800–1,200 mm for common pellets |
| Fan status | Vibration and bearing temperature monitored |
4.7- Conveying and elevator downtime
Conveying systems create frequent hidden downtime because small blockages and belt slips may not be recorded accurately.
Common causes:
*- Bucket elevator belt deviation
*- Chain conveyor overload
*- Screw conveyor blockage
*- Magnet full of metal
*- Bearing overheating
*- Chain elongation
*- Dust explosion safety interlock alarm
Recommended controls:
| Equipment | Inspection Item |
|---|---|
| Bucket elevator | Belt tension, bucket wear, speed sensor |
| Chain conveyor | Chain tension, scraper wear, bearing temperature |
| Screw conveyor | Flight wear, blockage, motor current |
| Belt conveyor | Belt tracking, roller condition, material spillage |
| Magnets | Clean every shift |
| Safety sensors | Test routinely |
4.8- Bagging and packaging downtime
Packaging is often the final bottleneck. Even if the upstream production line is running well, poor bagging reliability can reduce actual dispatch capacity.
Common causes:
*- Bag clamp failure
*- Weighing gate delay
*- Load cell drift
*- Sewing machine thread break
*- Heat sealer fault
*- Dust affecting sensors
*- Palletizer alarm
*- Printer or label error
Recommended packaging KPIs:
| KPI | Target |
|---|---|
| Bagging speed | Stable according to bag size |
| Weight accuracy | ±0.1%–0.2% for many bagging systems |
| Rejected bags | Continuous reduction |
| Sewing/sealing failure | Track per 1,000 bags |
| Bagging downtime | Record by reason code |
| Scale calibration | Daily quick check |
5- Downtime Reduction Strategy
5.1- Build a downtime reason code system
Many feed mills record only “machine stopped,” which is not useful. A downtime system should classify every stoppage.
Recommended downtime reason codes:
| Code | Category | Example |
|---|---|---|
| M01 | Mechanical failure | Bearing failure |
| E01 | Electrical failure | Motor trip |
| P01 | Process blockage | Pellet mill jam |
| Q01 | Quality hold | Wrong formula or poor PDI |
| R01 | Raw material issue | Silo empty or bridging |
| C01 | Cleaning/changeover | Formula change cleaning |
| U01 | Utility issue | Steam pressure loss |
| B01 | Bagging issue | Sewing machine fault |
| A01 | Automation/sensor | Level sensor error |
Every stoppage longer than 3–5 minutes should be recorded with:
*- Start time
*- End time
*- Equipment
*- Reason code
*- Immediate cause
*- Root cause if known
*- Repair action
*- Spare parts used
*- Responsible department
5.2- Apply Pareto analysis
Downtime is usually concentrated in a few causes. A Pareto analysis often shows that 20% of causes create 80% of lost time.
Example monthly downtime analysis:
| Downtime Cause | Frequency | Total Lost Time | Share |
|---|---|---|---|
| Pellet mill blockage | 12 | 18 h | 30% |
| Bagging machine fault | 25 | 10 h | 17% |
| Hammer mill screen change | 8 | 8 h | 13% |
| Bucket elevator slip | 6 | 7 h | 12% |
| Steam pressure fluctuation | 10 | 6 h | 10% |
| Other causes | 30 | 11 h | 18% |
| Total | 91 | 60 h | 100% |
Priority:
1- Pellet mill blockage
2- Bagging machine fault
3- Hammer mill screen change
4- Bucket elevator slip
5- Steam pressure fluctuation
This approach prevents maintenance teams from wasting time on low-impact issues.
5.3- Shift from emergency maintenance to preventive maintenance
Preventive maintenance is scheduled before failure occurs. It reduces unplanned stoppages by replacing or adjusting parts before breakdown.
Planned maintenance is part of preventive or total productive maintenance strategy and allows managers to schedule labor and parts with less production disruption.
Recommended maintenance structure:
| Maintenance Type | Share in Mature Feed Mill | Purpose |
|---|---|---|
| Emergency maintenance | < 20% | Unavoidable unexpected failure |
| Preventive maintenance | 50%–70% | Scheduled inspection and replacement |
| Predictive maintenance | 10%–30% | Condition-based intervention |
| Improvement maintenance | 5%–15% | Design correction and reliability upgrade |
If emergency maintenance is more than 40% of total maintenance work, the plant is still operating in a reactive mode.
5.4- Use predictive maintenance for critical equipment
Predictive maintenance uses real-time or periodic condition data to detect abnormal trends before failure. Deloitte describes predictive maintenance as using IoT and real-time equipment insight to avoid unplanned downtime and minimize planned downtime.
Recommended predictive monitoring points:
| Equipment | Monitoring Parameter | Failure Detected |
|---|---|---|
| Pellet mill main motor | Current, power, vibration | Overload, imbalance |
| Pellet mill bearing | Temperature, vibration | Bearing wear |
| Hammer mill rotor | Vibration, current | Imbalance, screen blockage |
| Bucket elevator | Speed, belt deviation | Slip or belt failure |
| Cooler fan | Vibration, bearing temperature | Fan imbalance |
| Air compressor | Pressure, temperature | Leakage or compressor failure |
| Steam system | Pressure, condensate, temperature | Trap failure or unstable conditioning |
Predictive maintenance does not replace preventive maintenance. It helps decide when maintenance should be done.
6- Preventive Maintenance Schedule for Animal Feed Factories
6.1- Daily inspection
| Area | Inspection Item |
|---|---|
| Raw material intake | Magnet, screen, dust collector |
| Hammer mill | Bearing temperature, vibration, screen condition |
| Mixer | Discharge gate, leakage, abnormal noise |
| Pellet mill | Roller sound, die condition, motor load |
| Conditioner | Steam pressure, temperature stability |
| Cooler | Outlet temperature, discharge action |
| Conveyors | Belt tracking, chain tension, bearing noise |
| Bagging | Scale accuracy, sewing/sealing status |
| Utilities | Air pressure, steam pressure, boiler water level |
6.2- Weekly maintenance
| Equipment | Weekly Work |
|---|---|
| Hammer mill | Inspect hammers and screens |
| Pellet mill | Check roller gap, knives, die holes |
| Conditioner | Clean buildup and inspect paddles |
| Cooler | Clean discharge grid and sensors |
| Conveyors | Check tension and lubrication |
| Bagging scale | Verify calibration |
| Dust collector | Inspect bags/cartridges |
| Compressor | Drain water and inspect filters |
6.3- Monthly maintenance
| Equipment | Monthly Work |
|---|---|
| Pellet mill | Bearing temperature trend review |
| Die and rollers | Wear measurement |
| Hammer mill | Rotor balance and wear review |
| Electrical cabinet | Clean dust and check terminals |
| Motors | Insulation and vibration check |
| Steam traps | Functional test |
| Load cells | Full calibration |
| Safety interlocks | Test and record |
6.4- Maintenance by production tonnage
Some parts should be replaced by tonnage, not calendar time.
| Part | Recommended Control Basis |
|---|---|
| Hammer | Tons ground + particle size trend |
| Screen | Tons ground + visual inspection |
| Pellet die | Tons produced + hole wear + PDI |
| Roller shell | Tons produced + surface wear |
| Conveyor chain | Running hours + elongation |
| Bucket elevator belt | Running hours + tension/tracking |
| Bagging sewing needle | Bags produced |
| Filter bags | Pressure differential + dust condition |
7- Spare Parts Strategy
Long MTTR is often caused by missing spare parts, not repair complexity.
7.1- Spare parts classification
| Spare Part Class | Examples | Stock Strategy |
|---|---|---|
| A: Critical shutdown parts | Pellet mill bearing, die clamp, main belt, elevator belt | Keep on site |
| B: High-wear parts | Hammers, screens, rollers, knives, sewing needles | Stock by consumption rate |
| C: Standard parts | Bolts, seals, sensors, belts | Minimum stock level |
| D: Long-lead imported parts | PLC modules, special bearings, gear reducers | Safety stock or supplier agreement |
7.2- Minimum spare parts list
| System | Recommended Spare Parts |
|---|---|
| Hammer mill | Hammers, screens, bearings, belts |
| Pellet mill | Die, rollers, bearings, oil seals, knives, shear pins |
| Conditioner | Paddles, steam valve, temperature sensor |
| Cooler | Level sensor, discharge cylinder, fan belt, bearings |
| Conveyors | Chains, sprockets, buckets, belts, bearings |
| Bagging | Load cell, cylinder, sewing needle, thread, sensor |
| Electrical | Contactors, relays, inverter fan, proximity switches |
| Utilities | Steam traps, pressure gauges, compressor filters |
7.3- Spare parts KPI
| KPI | Recommended Target |
|---|---|
| Critical spare availability | ≥ 95% |
| Stockout for A-class parts | 0 |
| Spare parts accuracy | ≥ 98% |
| Emergency purchase rate | Continuous reduction |
| Obsolete spare stock | Reviewed quarterly |
8- Operator Training and Autonomous Maintenance
Operators are the first line of downtime prevention. They see abnormal sound, vibration, smell, temperature, leakage, and blockage before maintenance staff.
8.1- Operator inspection checklist
Operators should check:
*- Abnormal motor current
*- Abnormal sound
*- Bearing temperature
*- Material flow stability
*- Steam pressure fluctuation
*- Pellet quality change
*- Fines increase
*- Dust leakage
*- Conveyor belt deviation
*- Bagging weight drift
8.2- Autonomous maintenance tasks
| Task | Operator Responsibility |
|---|---|
| Cleaning | Remove dust and material buildup |
| Lubrication check | Confirm lubrication points are serviced |
| Tightening | Report loose bolts or guards |
| Inspection | Record temperature, noise, vibration signs |
| Basic adjustment | Feeder speed, bag clamp, simple sensor cleaning |
| Reporting | Stop small defects before failure |
This does not mean operators replace maintenance technicians. It means operators prevent small abnormalities from becoming major failures.
9- Formula and Process Control to Reduce Downtime
Not all downtime is mechanical. Many stoppages are caused by formula and process instability.
9.1- Formula-related downtime
| Formula Issue | Downtime Result | Control |
|---|---|---|
| High fiber | Pellet mill overload | Adjust die and conditioning |
| High fat before pelleting | Roller slip, poor pellet quality | Shift oil to post-pellet application |
| Low moisture | Poor pellet formation, high energy | Adjust conditioning |
| Excess moisture | Die blockage | Control steam and water |
| Large particle size | Poor compression | Optimize grinding |
| Sticky ingredients | Conditioner and chute buildup | Improve cleaning and flow aid |
9.2- Start-up and shutdown control
Many blockages occur during start-up or shutdown.
Recommended start-up sequence:
1- Confirm raw material flow.
2- Start dust collection and utilities.
3- Start downstream conveyors first.
4- Start cooler and bagging readiness.
5- Start pellet mill empty.
6- Feed mash gradually.
7- Stabilize steam and conditioning.
8- Increase load to target gradually.
Recommended shutdown sequence:
1- Stop mash feeding.
2- Flush pellet mill if required.
3- Clear conditioner and die.
4- Empty conveyors and cooler.
5- Stop downstream equipment after material clears.
6- Record abnormalities.
10- Changeover Optimization
Feed factories often produce many formulas. Changeover downtime can be significant.
10.1- Main changeover losses
| Changeover Activity | Downtime Risk |
|---|---|
| Formula cleaning | Long stop if poorly planned |
| Die change | Major pellet mill downtime |
| Screen change | Grinding downtime |
| Micro-ingredient setup | Dosing error risk |
| Bag and label change | Packaging delay |
| Line flushing | Material loss and time loss |
10.2- Reduction methods
*- Group formulas by species and contamination risk.
*- Sequence production from low-risk to high-risk products.
*- Prepare dies, screens, labels, and bags before stoppage.
*- Use quick-change die tools.
*- Standardize cleaning procedures.
*- Record changeover time by product type.
Example target:
| Activity | Uncontrolled Time | Improved Target |
|---|---|---|
| Screen change | 45 min | 20–30 min |
| Die change | 2–3 h | 45–90 min |
| Bag label change | 20 min | 5–10 min |
| Formula cleaning | 60 min | 30–45 min |
11- Automation and Digital Downtime Control
Automation reduces downtime by preventing human error and detecting abnormal conditions early.
Recommended functions:
| Automation Function | Downtime Reduction Effect |
|---|---|
| Motor load control | Prevents pellet mill overload |
| Bin level monitoring | Prevents empty-bin stoppage |
| Batch tracking | Prevents wrong formula |
| Automatic alarms | Detects abnormal trends early |
| Online moisture sensor | Prevents quality hold and rework |
| Bearing temperature sensor | Prevents catastrophic failure |
| Vibration monitoring | Detects imbalance and bearing defects |
| Bagging feedback control | Reduces packaging stoppage |
| CMMS system | Plans maintenance and spare parts |
Predictive maintenance systems use equipment data to support targeted interventions and reduce both planned and unplanned downtime, although they require investment and technical complexity.
12- Practical Case Study: Reducing Downtime in a 10 TPH Feed Factory
12.1- Original condition
| Item | Current Value |
|---|---|
| Production capacity | 10 TPH |
| Scheduled production time | 10 h/day |
| Unplanned downtime | 90 min/day |
| Actual production | 85 t/day |
| Main stoppage causes | Pellet mill blockage, bagging fault, hammer mill screen issue |
| Average MTBF | 18 h |
| Average MTTR | 1.5 h |
| OEE | 68% |
12.2- Downtime Pareto
| Cause | Lost Time per Month | Share |
|---|---|---|
| Pellet mill blockage | 22 h | 32% |
| Bagging machine fault | 14 h | 20% |
| Hammer mill screen failure | 10 h | 15% |
| Bucket elevator slip | 8 h | 12% |
| Steam pressure fluctuation | 6 h | 9% |
| Others | 8 h | 12% |
| Total | 68 h | 100% |
12.3- Improvement actions
| Problem | Action |
|---|---|
| Pellet mill blockage | Adjust conditioning moisture, install load control, inspect die holes |
| Bagging fault | Replace worn clamps, clean sensors, calibrate load cells |
| Screen failure | Add magnet cleaning schedule, replace screen by tonnage |
| Elevator slip | Adjust belt tension and install speed sensor alarm |
| Steam fluctuation | Inspect steam trap, stabilize pressure control |
| Long repair time | Build critical spare parts cabinet |
| Poor recording | Use downtime reason codes |
12.4- Expected result
| Indicator | Before | After Target |
|---|---|---|
| Unplanned downtime | 90 min/day | 35–45 min/day |
| MTBF | 18 h | 40–60 h |
| MTTR | 1.5 h | 0.7–1.0 h |
| OEE | 68% | 78%–82% |
| Actual output | 85 t/day | 93–96 t/day |
| Emergency maintenance share | 45% | < 25% |
| Fines/rework | High | Reduced |
12.5- Economic effect
If downtime is reduced by 45 minutes per day:
| Item | Value |
|---|---|
| Extra available production time | 0.75 h/day |
| Capacity | 10 t/h |
| Extra production opportunity | 7.5 t/day |
| Contribution margin | $20/t |
| Daily margin recovery | $150/day |
| Annual recovery, 300 days | $45,000/year |
This does not include savings from lower emergency repair, lower rework, better delivery reliability, and improved customer satisfaction.
13- Recommended Downtime Reduction Roadmap
Phase 1: Measure
Duration: 2–4 weeks
Actions:
*- Record every stoppage longer than 3–5 minutes.
*- Use downtime reason codes.
*- Calculate OEE, MTBF, and MTTR.
*- Identify top 5 downtime causes.
*- Separate planned and unplanned downtime.
Phase 2: Stabilize
Duration: 1–2 months
Actions:
*- Fix recurring blockages.
*- Standardize start-up and shutdown.
*- Clean magnets, screens, bins, and sensors.
*- Calibrate weighing and control systems.
*- Build critical spare parts list.
Phase 3: Prevent
Duration: 2–6 months
Actions:
*- Implement preventive maintenance schedule.
*- Replace parts based on tonnage and condition.
*- Train operators for autonomous inspection.
*- Standardize die, roller, hammer, and screen management.
*- Improve formula and conditioning control.
Phase 4: Predict
Duration: 6–12 months
Actions:
*- Add vibration and temperature monitoring.
*- Install pellet mill load trend monitoring.
*- Use online moisture and cooler data.
*- Apply CMMS or digital maintenance system.
*- Review reliability KPIs monthly.
14- Recommended KPI Dashboard
| KPI | Formula | Target |
|---|---|---|
| OEE | Availability × Performance × Quality | ≥ 75% first target, ≥ 85% advanced |
| Availability | Running time / scheduled time | ≥ 85%–90% |
| MTBF | Operating time / failures | Continuous increase |
| MTTR | Repair time / failures | Continuous decrease |
| Unplanned downtime | Total unplanned stop time | < 5%–8% of scheduled time |
| Emergency maintenance share | Emergency work / total maintenance | < 20%–25% |
| Pellet mill blockage frequency | Events/month | Continuous reduction |
| Bagging stoppage | min/day | Continuous reduction |
| Critical spare availability | Available critical parts / required parts | ≥ 95% |
| Planned maintenance completion | Completed PM / scheduled PM | ≥ 90% |
| Rework rate | Reworked feed / total feed | ≤ 1%–2% |
15- Practical Checklist for Feed Mill Downtime Reduction
Production management
*- Are all stoppages longer than 3–5 minutes recorded?
*- Are downtime reasons classified correctly?
*- Is OEE calculated by line and by key equipment?
*- Are the top 5 downtime causes reviewed weekly?
*- Is production sequencing optimized to reduce changeover?
Maintenance
*- Is emergency maintenance below 25% of total maintenance?
*- Are pellet mill dies, rollers, bearings, hammers, and screens managed by tonnage?
*- Are critical spare parts available on site?
*- Are bearings monitored by temperature or vibration?
*- Are steam traps and condensate systems inspected regularly?
Pellet mill
*- Is the pellet mill operating at stable load?
*- Is the roller-die gap correct?
*- Are die holes blocked or worn?
*- Is conditioning moisture controlled?
*- Is main motor current stable?
Utilities
*- Is steam pressure stable?
*- Is compressed air pressure stable?
*- Are dust collectors maintained?
*- Are electrical cabinets clean and protected from dust?
Packaging
*- Are bagging faults recorded separately?
*- Are load cells calibrated?
*- Are bag clamps, sensors, sewing machines, and sealers maintained?
*- Is packaging capacity matched with pellet mill output?
Conclusion
Reducing downtime in animal feed factories requires a structured reliability system, not only faster emergency repair. The most important step is to measure downtime accurately, classify the causes, and focus improvement efforts on the equipment and problems that create the largest production loss.
For most feed factories, downtime reduction should focus on:
1- Pellet mill blockage and die/roller reliability.
2- Hammer mill screens, hammers, and bearings.
3- Steam and conditioning stability.
4- Cooler discharge and sensor reliability.
5- Conveying blockages and elevator slip.
6- Bagging and packaging stoppages.
7- Spare parts availability.
8- Operator inspection and preventive maintenance.
9- Digital monitoring of vibration, temperature, current, moisture, and load.
10- Continuous KPI tracking through OEE, MTBF, and MTTR.
In practical operation, reducing unplanned downtime by 30%–50% is achievable for many feed mills that currently rely heavily on reactive maintenance. For a 10 TPH factory, even a reduction of 45 minutes per day can recover about 7.5 tons of daily production opportunity, improve delivery reliability, reduce emergency repair cost, and create a more stable production environment.
The final goal is not simply to keep machines running. The real goal is to produce more saleable feed per scheduled hour, with stable quality, lower cost per ton, safer operation, and fewer unexpected production interruptions.