
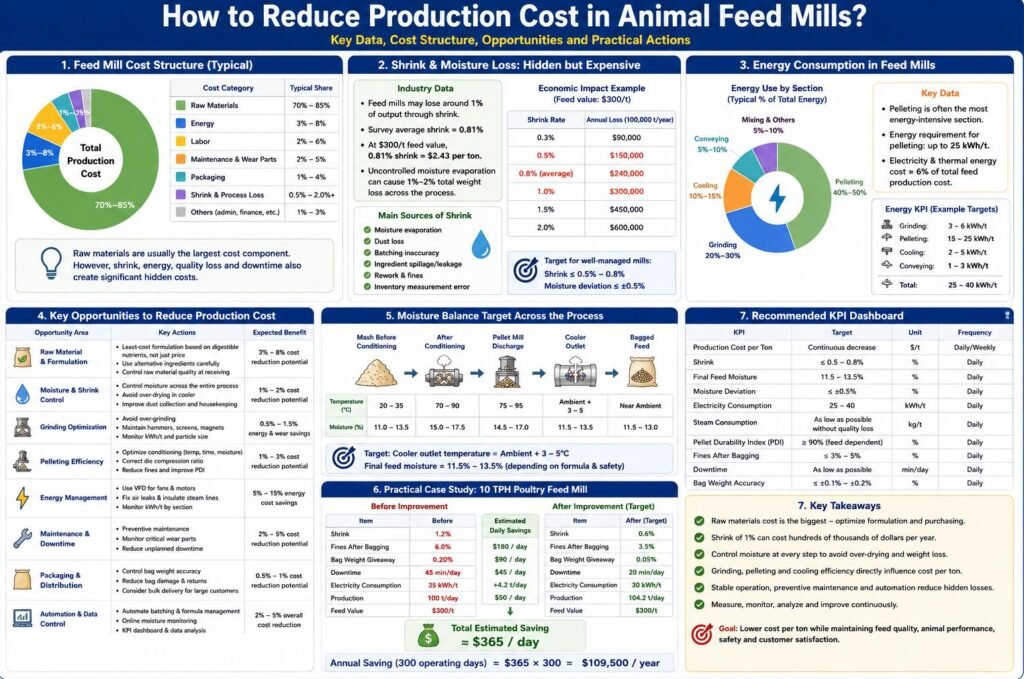
Reducing production cost in animal feed mills requires a systematic approach that covers raw material purchasing, formula design, grinding, batching, mixing, conditioning, pelleting, cooling, packaging, energy use, maintenance, labor productivity, and process losses. In most feed mills, the largest cost item is not electricity or labor, but raw materials. However, operational losses such as moisture shrink, fines, rework, over-grinding, poor pelleting efficiency, excessive energy consumption, and unplanned downtime can significantly increase the final cost per ton.
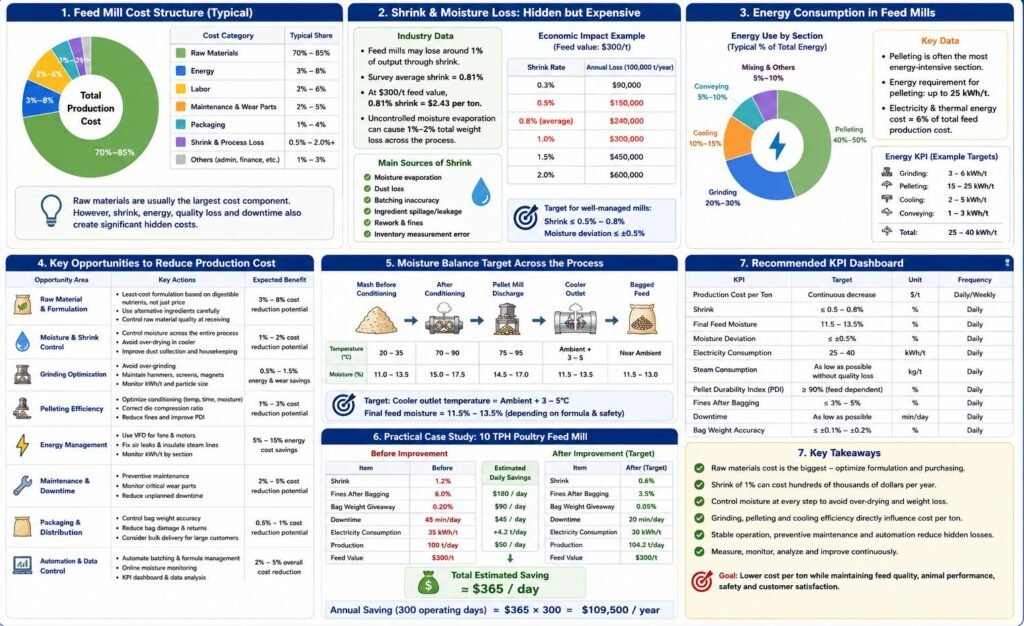
Industry references show that feed mills may lose around 1% of output through shrink, and one feed mill survey reported average shrink of 0.81%, equal to $2.43 per ton when feed value is $300/t. For a 6,000 t/week feed mill, this equals about $14,500 per week in shrink loss. Other industry data indicate that uncontrolled moisture evaporation across grinding, conditioning, pelleting, cooling, and storage can cause 1%–2% total production weight loss.
Energy is also important. Feed manufacturing requires mechanical and thermal energy for grinding, mixing, conditioning, pelleting, and cooling; pelleting is often the most energy-intensive section, with published references reporting up to 25 kWh/t for pelleting. However, electricity and thermal energy may represent only about 6% of total feed production cost, which means energy saving is important but cannot replace raw material, shrink, formulation, and throughput control.
The core principle is simple: reduce cost per ton without reducing feed performance, pellet quality, safety, or customer trust.
1- Cost Structure of Animal Feed Mills
A feed mill’s production cost can be divided into direct material cost, processing cost, quality cost, and loss cost.
1.1- Typical cost categories
| Cost Category | Typical Share of Total Cost | Main Control Method |
|---|---|---|
| Raw materials | 70%–85% | Purchasing, formulation, ingredient substitution, inventory control |
| Energy | 3%–8% | Grinding optimization, steam efficiency, pellet mill load control |
| Labor | 2%–6% | Automation, workflow design, shift efficiency |
| Maintenance and wear parts | 2%–5% | Preventive maintenance, die/roller/hammer management |
| Packaging | 1%–4% | Bag specification, bulk delivery, weighing accuracy |
| Shrink and process loss | 0.5%–2.0%+ | Moisture control, dust recovery, accurate batching |
| Quality loss and rework | Variable | Process stability, PDI control, formulation consistency |
For most mills, the largest cost-saving opportunities come from:
1- Raw material optimization.
2- Moisture and shrink control.
3- Grinding and pelleting efficiency.
4- Downtime reduction.
5- Fines and rework reduction.
6- Automation and data-based management.
2- Reduce Raw Material Cost Without Reducing Nutritional Value
Raw materials are usually the largest cost component in animal feed production. Therefore, formula optimization often produces the greatest cost reduction.
2.1- Use least-cost formulation correctly
Least-cost formulation should not mean “using the cheapest ingredients.” It should mean achieving the required nutrient profile at the lowest total cost while maintaining:
*- Animal performance.
*- Digestibility.
*- Pellet quality.
*- Ingredient safety.
*- Palatability.
*- Mycotoxin control.
*- Customer acceptance.
2.2- Monitor nutrient cost, not ingredient price only
An ingredient with a lower purchase price may not reduce cost if its digestible nutrient value is poor.
Example comparison:
| Ingredient | Price | Crude Protein | Digestible Protein Value | Practical Decision |
|---|---|---|---|---|
| Soybean meal A | $450/t | 46% | High | Higher price but stable value |
| Soybean meal B | $420/t | 43% | Medium | Cheaper per ton but may be expensive per unit nutrient |
| DDGS | $280/t | 27% | Variable | Useful if amino acid balance and fiber level are controlled |
| Wheat bran | $180/t | Low to medium | Fiber-rich | Low price but may reduce pellet durability and energy density |
Feed mills should calculate:
Cost per unit of digestible amino acid, metabolizable energy, available phosphorus, and effective protein, not only cost per ton of ingredient.
2.3- Use alternative ingredients carefully
Alternative raw materials can reduce formula cost, but they often affect grinding behavior, pellet durability, feed intake, fiber level, and energy consumption. Recent research on pellet manufacturing also notes that coproducts and fiber characteristics can affect pellet quality and energy cost, so formulation decisions should include manufacturing effects, not only nutrient price.
Recommended evaluation table:
| Alternative Ingredient | Cost Advantage | Main Risk | Engineering Control |
|---|---|---|---|
| DDGS | Lower protein/energy cost | High fiber, variable oil, mycotoxin risk | Test moisture, fiber, mycotoxin, pellet quality |
| Wheat middlings | Good binder effect | Variable quality | Control inclusion and particle size |
| Rice bran | Energy and fiber source | Rancidity, oil variation | Control freshness and storage |
| Palm kernel meal | Low-cost fiber/protein | High fiber, lower digestibility | Use enzyme and formula limit |
| Bakery meal | Energy source | Fat and sugar variation | Check moisture and microbial risk |
| Rapeseed meal | Protein source | Glucosinolates, fiber | Species-specific inclusion limit |
2.4- Control raw material quality at receiving
Poor raw material control creates hidden production cost.
Key control points:
| Item | Cost Impact |
|---|---|
| Moisture too high | Mold risk, storage loss, inaccurate formula cost |
| Moisture too low | Pay for less usable water, more dust |
| High impurities | Lower nutrient value, equipment wear |
| Variable particle size | Grinding instability |
| Mycotoxins | Rejection, animal performance loss |
| Oil rancidity | Palatability and safety loss |
| Poor flowability | Silo blockage, labor cost |
Recommended receiving controls:
*- Moisture testing for each batch.
*- Bulk density recording.
*- Impurity and foreign matter inspection.
*- Mycotoxin risk testing for corn, wheat, DDGS, bran, and oilseed meals.
*- Supplier ranking based on nutrient consistency, not only price.
3- Reduce Shrink and Moisture Loss
Shrink is one of the most underestimated cost factors in feed mills. It includes moisture evaporation, dust loss, leakage, ingredient transfer loss, batching deviation, spillage, and inventory error.
A Kansas State-related feed mill industry survey cited by World Grain reported average shrink of 0.81%, with a range from 2.5% shrink to 1.09% gain. At $300/t feed value, 0.81% shrink equals $2.43/t. Another industry article states that up to 1% shrink is often regarded as a standard or expected range, and for an annual production of 200,000 t at $250/t, 1% shrink equals $500,000 per year.
3.1- Economic effect of shrink
| Annual Production | Feed Value | Shrink Rate | Annual Loss |
|---|---|---|---|
| 50,000 t | $300/t | 0.5% | $75,000 |
| 50,000 t | $300/t | 1.0% | $150,000 |
| 100,000 t | $300/t | 1.0% | $300,000 |
| 200,000 t | $250/t | 1.0% | $500,000 |
| 300,000 t | $300/t | 0.8% | $720,000 |
3.2- Main sources of shrink
| Source | Typical Cause | Control Method |
|---|---|---|
| Moisture evaporation | Over-drying in grinding, pelleting, cooling | Moisture balance and cooler control |
| Dust loss | Poor aspiration, leakage, transfer points | Dust recovery and sealed conveying |
| Batching error | Scale drift, poor dosing accuracy | Scale calibration |
| Ingredient loss | Spillage, bin leakage, conveyor residue | Housekeeping and equipment inspection |
| Rework loss | Poor pellet quality, fines, rejected batches | Process stability |
| Inventory error | Manual records, poor silo measurement | Digital inventory management |
3.3- Control moisture as a financial KPI
Uncontrolled moisture evaporation of 1%–2% total production weight has been reported across grinding, conditioning, pelleting, cooling, and storage. For a 10 TPH feed mill:
| Avoidable Moisture Loss | Lost Weight per Hour | Lost Weight per 10 h Shift |
|---|---|---|
| 0.3% | 30 kg/h | 300 kg |
| 0.5% | 50 kg/h | 500 kg |
| 1.0% | 100 kg/h | 1,000 kg |
| 1.5% | 150 kg/h | 1,500 kg |
Practical control targets:
| Parameter | Recommended Target |
|---|---|
| Final feed moisture | 11.5%–13.5%, depending on formula and safety requirement |
| Moisture deviation between batches | ≤ ±0.5% |
| Cooler outlet temperature | Ambient + 3–5°C |
| Shrink target | ≤ 0.5%–0.8% for well-managed mills |
| Dust return system | Required for high-volume production |
4- Optimize Grinding Cost
Grinding affects feed digestibility, mixing uniformity, pellet quality, energy consumption, hammer/roller wear, and throughput.
Over-grinding increases power consumption and reduces capacity. Under-grinding may reduce pellet quality and nutrient availability.
4.1- Practical particle size targets
| Feed Type | Suggested Particle Size Range |
|---|---|
| Broiler feed | 600–900 µm |
| Layer feed | 700–1,000 µm |
| Piglet feed | 400–600 µm |
| Grower-finisher pig feed | 500–700 µm |
| Cattle feed | 800–1,200 µm |
| Aquafeed | 250–500 µm |
| Premix carrier materials | Depends on mixing requirement |
4.2- Hammer mill vs roller mill
CPM’s grinding economics reference notes that energy cost comparisons depend heavily on finished particle size and machine type, and it uses $0.05/kWh in example calculations. It also reports roller mill maintenance costs commonly around $0.05–$0.09/t, with roll recorrugation representing 60%–70% of total maintenance cost.
| Equipment | Advantage | Cost Risk |
|---|---|---|
| Hammer mill | Flexible, suitable for many ingredients | Higher energy if over-grinding; screen and hammer wear |
| Roller mill | Uniform particle size, often lower energy for coarse grinding | Higher maintenance for rolls; less flexible for fibrous materials |
| Multi-stage grinding | Better control for aquafeed/piglet feed | Higher capital and control requirement |
4.3- Cost-saving actions in grinding
*- Avoid grinding finer than nutritional and pelleting requirements.
*- Maintain hammer sharpness and correct hammer-screen clearance.
*- Replace worn screens before capacity drops severely.
*- Use correct screen hole size for each formula.
*- Install magnet and stone removal before grinding.
*- Use variable-frequency feeding to stabilize motor load.
*- Monitor kWh/t, not only motor current.
Recommended KPI:
| KPI | Target |
|---|---|
| Hammer mill load | 80%–95% of rated load |
| Particle size CV | As low as practical for target product |
| Screen damage | Zero tolerance |
| Grinding energy | Track by formula |
| Capacity drop from worn parts | Correct before >10% loss |
5- Reduce Pelleting Cost
Pelleting is often the most energy-intensive process section in a feed mill. Published references describe pelleting as requiring up to 25 kWh/t, making it a major energy focus. Feed manufacturing also uses both mechanical and thermal energy, especially during conditioning and pelleting.
5.1- Main factors affecting pelleting cost
| Factor | Effect on Cost |
|---|---|
| Die compression ratio | Higher ratio improves durability but increases energy |
| Formula fat level | Reduces friction and energy but may reduce PDI |
| Fiber level | Often increases energy and reduces pellet quality |
| Particle size | Finer grinding improves binding but increases grinding cost |
| Conditioning quality | Improves throughput and PDI if controlled correctly |
| Die and roller wear | Increases energy and reduces capacity |
| Pellet mill feeding stability | Affects motor load and blockage risk |
5.2- Optimize conditioning
Good conditioning reduces pellet mill load, improves starch gelatinization, improves pellet durability, and increases throughput.
Recommended parameters:
| Feed Type | Conditioning Temperature | Retention Time |
|---|---|---|
| Broiler feed | 80–88°C | 30–60 s |
| Pig feed | 78–88°C | 40–90 s |
| Cattle feed | 70–82°C | 30–60 s |
| Aquafeed | 85–95°C | 60–180 s |
Cost-saving principle:
Good conditioning reduces mechanical energy demand, but excessive steam or moisture creates cooling, drying, and mold risks.
5.3- Select die compression ratio economically
| Formula Type | Low-Cost Risk | Recommended Control |
|---|---|---|
| Low-fiber standard feed | Excessive die compression wastes energy | Use moderate compression |
| High-fiber feed | Low compression causes poor PDI and rework | Use stronger die and better conditioning |
| High-fat feed | Fat reduces friction and PDI | Limit mixer oil or use post-pellet oil |
| Aquafeed | Requires high durability and water stability | Use higher compression or extrusion |
5.4- Reduce fines and rework
Fines increase cost because they require reprocessing, reduce bag quality, increase dust, and reduce customer satisfaction.
Recommended targets:
| Product | Fines Before Packing | Fines After Packing |
|---|---|---|
| Poultry feed pellets | ≤ 2%–3% | ≤ 3%–5% |
| Pig feed pellets | ≤ 2%–3% | ≤ 3%–5% |
| Aquafeed pellets | ≤ 1.5%–2.5% | ≤ 3%–4% |
| Cattle feed pellets | ≤ 3% | ≤ 4%–6% |
6- Reduce Cooling and Drying Loss
Cooling is necessary, but over-cooling and over-drying reduce yield.
6.1- Main cooling cost problems
| Problem | Cost Result |
|---|---|
| Excessive fan airflow | Higher electricity and moisture loss |
| Long retention time | Over-drying and lower yield |
| Poor bed depth control | Uneven moisture and product instability |
| Hot pellets sent to packing | Condensation, mold risk, complaints |
| Low outlet moisture | Lost saleable weight and brittle pellets |
6.2- Recommended cooler targets
| Parameter | Recommended Target |
|---|---|
| Cooler outlet temperature | Ambient + 3–5°C |
| Final pellet moisture | 11.5%–13.5% |
| Moisture variation | ≤ ±0.5% |
| Retention time | 5–8 min for many standard feed pellets |
| Bed depth | 800–1,200 mm for common pellets |
| Fines after cooler | ≤ 1%–2% preferred |
If a 10 TPH line loses an avoidable 1.0 percentage point of moisture, the lost product weight is about 100 kg/h, or 1 ton per 10-hour shift. This is often more expensive than the fan electricity itself.
7- Improve Batching and Mixing Accuracy
Batching errors increase cost in three ways:
1- Expensive ingredients may be over-added.
2- Nutrients may be under-supplied, causing animal performance problems.
3- Non-conforming batches may require rework or rejection.
7.1- Recommended batching accuracy
| Ingredient Type | Recommended Accuracy |
|---|---|
| Major ingredients | ±0.2%–0.5% |
| Minor ingredients | ±0.5%–1.0% |
| Micro-ingredients | ±1.0%–2.0%, depending on dosing system |
| Liquid ingredients | ±0.5%–1.0% |
7.2- Mixing uniformity target
| Feed Type | Mixing CV Target |
|---|---|
| General complete feed | ≤ 10% |
| Premix or medicated feed | ≤ 5%–7% |
| High-value aquafeed or young animal feed | ≤ 5%–8% |
Cost-saving actions:
*- Calibrate scales regularly.
*- Avoid manual micro-ingredient errors.
*- Use barcode or QR code ingredient verification.
*- Prevent cross-contamination and rework.
*- Match mixer fill level to design range.
*- Avoid excessive mixing time that wastes power and reduces throughput.
8- Reduce Downtime and Maintenance Cost
Unplanned downtime increases cost per ton because labor, power demand charges, steam system losses, and production schedule disruptions continue even when output stops.
8.1- Critical equipment for preventive maintenance
| Equipment | Main Wear Parts | Cost Risk |
|---|---|---|
| Hammer mill | Hammers, screens, bearings | High energy, low capacity |
| Pellet mill | Die, rollers, bearings, belts | Blockage, poor PDI, high kWh/t |
| Conditioner | Paddles, steam valves | Poor conditioning |
| Cooler | Discharge grid, fan, sensors | Over-drying or hot pellets |
| Bucket elevator | Belt, buckets, bearings | Product loss and downtime |
| Mixer | Paddles, ribbons, seals | Poor uniformity |
| Bagging scale | Load cells, gates | Weight error and giveaway |
8.2- Maintenance KPIs
| KPI | Recommended Target |
|---|---|
| Planned maintenance ratio | > 80% of total maintenance |
| Emergency stoppages | Continuous reduction month by month |
| Pellet mill die life | Track by formula and tonnage |
| Hammer/screen replacement | Based on kWh/t and particle size, not only time |
| Bagging scale calibration | Daily quick check, scheduled full calibration |
| Bearing temperature | Online or routine infrared monitoring |
9- Reduce Packaging and Finished Product Loss
Packaging cost includes bags, labels, sewing thread, labor, weighing error, rejected bags, dust, and product giveaway.
9.1- Control weighing accuracy
If a 40 kg bag is overfilled by 100 g, the giveaway is:
100 g / 40 kg = 0.25%
For a plant producing 200 tons/day in bags, this equals:
200 t × 0.25% = 0.5 t/day giveaway
At $300/t, this is:
0.5 × $300 = $150/day
9.2- Packaging cost controls
| Problem | Cost Effect | Solution |
|---|---|---|
| Overweight bags | Product giveaway | Calibrate scales and control feed gates |
| Underweight bags | Customer claims | Stable weighing control |
| Bag breakage | Product loss and rework | Select proper bag strength |
| Excess dust in bags | Customer complaints | Final screening |
| Manual stacking damage | Broken pellets | Improve conveyor and palletizing |
| Incorrect label | Product recall risk | Barcode and batch control |
9.3- Bulk delivery vs bagging
For large customers, bulk delivery can reduce packaging cost significantly, but it requires:
*- Bulk bins or silos at customer site.
*- Pneumatic or mechanical loading system.
*- Accurate truck scale.
*- Dust control.
*- Strong logistics management.
10- Improve Energy Management
Energy saving should be managed by measuring kWh/t, not only monthly electricity bills.
10.1- Energy KPIs by section
| Section | Main Energy Driver | KPI |
|---|---|---|
| Grinding | Particle size, screen condition, raw material hardness | kWh/t ground material |
| Mixing | Batch size and mixing time | kWh/batch |
| Pelleting | Die compression, formula, steam, throughput | kWh/t pellet |
| Cooling | Fan airflow and retention time | kWh/t cooled feed |
| Conveying | Layout and equipment sizing | kWh/t transferred |
| Air compressor | Leakage and pressure setting | kWh/m³ compressed air |
10.2- Practical energy reduction methods
*- Avoid idle running of motors.
*- Use VFD control on fans, feeders, and conveyors.
*- Optimize hammer mill screen size.
*- Keep pellet mill operating near stable full load.
*- Maintain dies, rollers, hammers, and screens.
*- Fix compressed air leakage.
*- Insulate steam pipes.
*- Return condensate where possible.
*- Reduce unnecessary conveying distance.
11- Improve Automation and Data Control
Manual operation often causes hidden cost through inconsistency.
Automation can reduce:
*- Batching errors.
*- Formula change mistakes.
*- Over-conditioning or under-conditioning.
*- Cooler over-drying.
*- Bag weight giveaway.
*- Downtime caused by late alarms.
*- Inventory mismatch.
Recommended automation modules:
| System | Cost Benefit |
|---|---|
| PLC batching system | Reduces dosing error and ingredient loss |
| Formula management software | Prevents wrong formula production |
| Online moisture sensor | Reduces shrink and over-drying |
| Pellet mill load control | Stabilizes throughput and energy |
| Cooler automatic discharge | Controls temperature and moisture |
| Bagging scale feedback | Reduces giveaway |
| OEE dashboard | Tracks real cost per ton |
12- Cost Reduction Model for a 10 TPH Feed Mill
12.1- Original condition
| Item | Current Value |
|---|---|
| Production capacity | 10 TPH |
| Operating time | 10 h/day |
| Feed value | $300/t |
| Shrink | 1.2% |
| Fines after bagging | 6.0% |
| Overweight giveaway | 0.20% |
| Pellet mill downtime | 45 min/day |
| Electricity consumption | 35 kWh/t |
| Electricity price | $0.10/kWh |
12.2- Improvement plan
| Cost Area | Before | After Target |
|---|---|---|
| Shrink | 1.2% | 0.6% |
| Fines after bagging | 6.0% | 3.5% |
| Overweight giveaway | 0.20% | 0.05% |
| Downtime | 45 min/day | 20 min/day |
| Electricity consumption | 35 kWh/t | 30 kWh/t |
12.3- Estimated savings
| Saving Source | Calculation | Estimated Saving |
|---|---|---|
| Shrink reduction | 100 t/day × 0.6% × $300/t | $180/day |
| Giveaway reduction | 100 t/day × 0.15% × $300/t | $45/day |
| Energy reduction | 100 t/day × 5 kWh/t × $0.10 | $50/day |
| Downtime recovery | 25 min/day extra production ≈ 4.17 t × contribution margin | Depends on margin |
| Fines reduction | Less rework, fewer complaints | Plant-specific |
Even before calculating downtime and quality benefits, shrink, giveaway, and electricity improvement alone can save about:
$275/day
At 300 operating days per year:
$82,500/year
This example shows that many cost reductions come from small percentage improvements repeated every day.
13- Recommended Cost Reduction Priorities
Priority 1: Measure real cost per ton
A feed mill cannot reduce what it does not measure.
Essential KPIs:
| KPI | Unit |
|---|---|
| Raw material cost | $/t finished feed |
| Shrink | % |
| Moisture loss | percentage points |
| Electricity | kWh/t |
| Steam consumption | kg/t |
| Pellet mill throughput | t/h |
| PDI | % |
| Fines after bagging | % |
| Downtime | min/day |
| Bag weight giveaway | % |
| Rework | % |
Priority 2: Control shrink and moisture
Shrink reduction often gives faster financial return than many equipment upgrades.
Priority 3: Optimize formula and raw material purchasing
Least-cost formulation must include processing effect, not only nutrient price.
Priority 4: Improve grinding and pelleting efficiency
Grinding and pelleting strongly affect energy, throughput, pellet quality, and maintenance cost.
Priority 5: Reduce downtime
Stable production lowers cost per ton more effectively than short-term high-speed operation.
Priority 6: Improve automation
Automation reduces variability, which is one of the biggest hidden costs in feed production.
14- Practical Checklist for Feed Mill Cost Reduction
Raw material and formulation
*- Are raw materials purchased based on digestible nutrient cost?
*- Are supplier moisture and nutrient variations recorded?
*- Are alternative ingredients tested for pellet quality impact?
*- Are high-cost ingredients over-formulated for unnecessary safety margins?
*- Are formulas updated according to current raw material prices?
Grinding
*- Is particle size measured regularly?
*- Are hammer screens and hammers replaced based on kWh/t and particle size?
*- Is over-grinding increasing energy cost?
*- Is the grinding system operating at stable full load?
Batching and mixing
*- Are scales calibrated regularly?
*- Are micro-ingredients verified by barcode or double-checking?
*- Is mixer CV tested?
*- Is mixing time optimized rather than excessive?
Pelleting
*- Is pellet mill load stable?
*- Is die compression ratio matched to formula?
*- Is conditioning temperature correct?
*- Is steam quality stable?
*- Are fines and PDI monitored every shift?
Cooling
*- Is final moisture too low?
*- Is cooler outlet temperature ambient + 3–5°C?
*- Is fan airflow controlled by temperature and moisture?
*- Is over-drying causing yield loss?
Packaging
*- Are bag weights checked frequently?
*- Is overweight giveaway controlled?
*- Is final screening installed before packing?
*- Are bags damaged during palletizing?
Maintenance
*- Is maintenance mostly preventive rather than emergency?
*- Are spare parts available for critical equipment?
*- Are die, roller, hammer, screen, and bearing conditions tracked?
15- Conclusion
Reducing production cost in animal feed mills is not achieved by one single action. It requires an integrated cost-control system covering raw materials, formulation, moisture, grinding, pelleting, cooling, packaging, energy, maintenance, labor, and quality control.
The most important principle is:
Cost per ton must be reduced without reducing nutritional value, pellet quality, feed safety, or animal performance.
For most animal feed mills, the most effective cost reduction strategy is:
1- Optimize raw material purchasing based on nutrient value, not only price.
2- Use least-cost formulation while considering pellet quality and processing cost.
3- Reduce shrink and moisture loss through moisture balance control.
4- Avoid over-grinding and manage particle size by feed type.
5- Improve conditioning and pellet mill efficiency.
6- Prevent over-drying in the cooler.
7- Reduce fines, rework, and customer complaints.
8- Control bag weight giveaway.
9- Reduce downtime through preventive maintenance.
10- Use automation and KPI tracking to manage cost per ton continuously.
In practical feed mill operation, even small improvements create large financial impact. Reducing shrink by 0.5%, lowering electricity use by 3–5 kWh/t, reducing bag giveaway by 0.1%–0.2%, and improving pellet mill uptime can save tens of thousands to hundreds of thousands of dollars per year, depending on plant capacity. For a modern animal feed mill, production cost control should therefore be managed as a continuous engineering discipline, not as a temporary cost-cutting campaign.